
TRT
October 16, 2026
Testosterone half-life: doses, steady state, and peaks and troughs
On this page
When you start testosterone replacement therapy, it is natural to wonder how long each dose lasts. You may also hear that smaller, more frequent injections produce steadier levels—and wonder whether that means steadier energy, fewer side effects or better results.
Half-life helps explain the timing. It tells us how quickly a drug's concentration declines, which helps explain why a new dose can overlap with earlier doses and why a schedule change takes time to assess. It doesn't tell us exactly how someone will feel on a particular day.
For injectable TRT, the formulation matters as much as the word “testosterone.” Cypionate and enanthate are designed to release testosterone over time, while gels and long-acting preparations have different patterns. This article focuses on the commonly discussed cypionate and enanthate injections. Our TRT guide covers diagnosis, benefits and monitoring more broadly.
Half-life, in everyday terms
Imagine a drug concentration of 100 on an arbitrary scale. After one half-life it falls to 50. After two, it falls to 25. After three, 12.5 remains. Each interval halves what is left.
That is the basic idea behind first-order elimination. It is a useful starting model, although an injected oil depot adds a period of absorption before and during the measured decline. A blood concentration is also different from the number of milligrams printed on a vial. Half-life background
The US prescribing information gives an approximate half-life of eight days for intramuscular testosterone cypionate. The route matters: this is the estimate given for that preparation injected into muscle, not a universal value for every testosterone product or administration method. Cypionate prescribing information
Using eight days purely to illustrate the arithmetic gives the following decline:
Time in the simplified decline
8 days: one half-life
- Percentage of the starting concentration remaining
- 50%
Time in the simplified decline
16 days: two half-lives
- Percentage of the starting concentration remaining
- 25%
Time in the simplified decline
24 days: three half-lives
- Percentage of the starting concentration remaining
- 12.5%
Time in the simplified decline
32 days: four half-lives
- Percentage of the starting concentration remaining
- 6.25%
Time in the simplified decline
40 days: five half-lives
- Percentage of the starting concentration remaining
- 3.125%
This table assumes no further input and a constant eight-day half-life. It is not a prediction of your total testosterone after a final injection: absorption, previous doses and the body's own production complicate that calculation. It also doesn't identify a date when symptoms or fertility return to baseline.
Why an injection keeps contributing for days
An ester is a chemical attachment to the testosterone molecule. In an oil-based injectable preparation, the formulation allows gradual absorption from the injection area. The ester is removed as the drug is processed, making testosterone available to act in the body.
That slow delivery is why a cypionate injection behaves differently from testosterone simply appearing all at once in the bloodstream. The observed concentration depends on input from the depot as well as the body's handling of testosterone. Cypionate prescribing information, clinical pharmacology
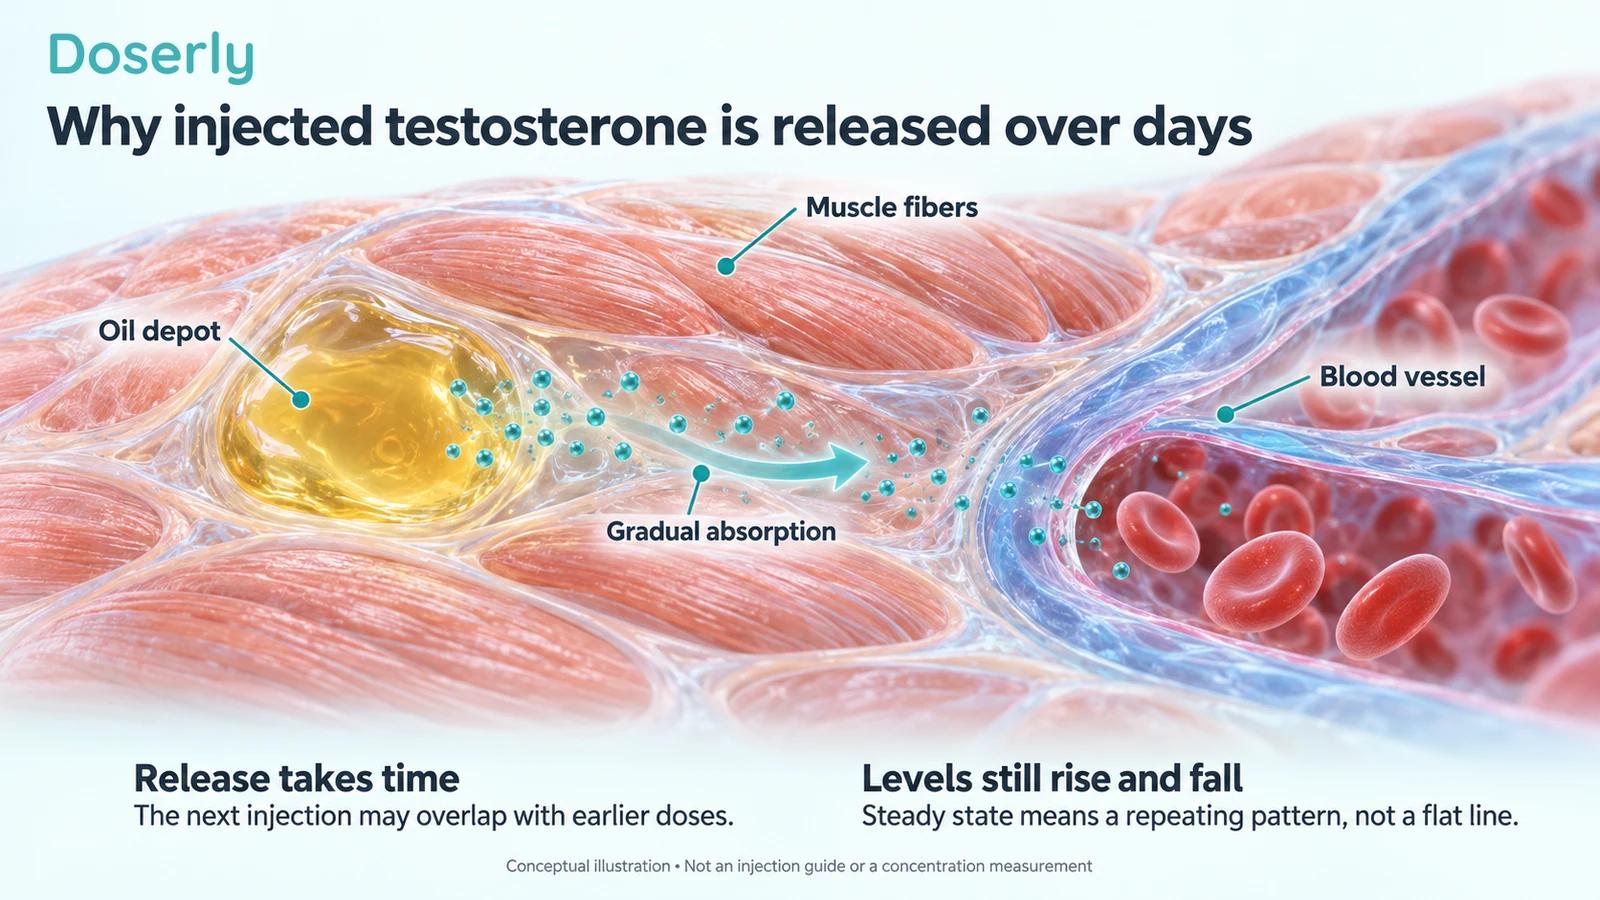
In a small human study published in 1987, eleven men with hypogonadism received 200 mg of intramuscular testosterone cypionate. Testosterone peaked during days two to five and declined toward baseline by days thirteen to fourteen. That describes a specific studied regimen; it is not a recommended starting dose. It shows why the highest concentration can occur days after an injection. Nankin's pharmacokinetic study
A peak several days after treatment, an eight-day half-life, and a return toward a person's baseline are three different observations. They can coexist. “Baseline” does not mean every molecule from the injection has disappeared.
How doses build on one another
If the next injection happens while earlier injections are still contributing, their effects on exposure overlap. This is accumulation. It is expected with many repeated treatments.
Here is a deliberately simplified example. Imagine a drug that adds one unit immediately and is given again after each half-life. Half a unit remains before dose two, so the new total is 1.5. Before dose three, 0.75 remains, so the next total is 1.75. Subsequent peaks approach two units rather than increasing indefinitely.
The example assumes instant absorption, unlike an oil depot. What it teaches is the overlap: the same amount administered later in treatment can produce a different total concentration from the first dose because there is already drug present.
This is one reason the first week is an incomplete picture of a new long-acting regimen. It is also why changing the amount repeatedly can make the resulting blood tests difficult to interpret. A result may reflect the previous prescription, the new one and the transition between them.
Steady state is a repeating pattern
Steady state means that, over each dosing interval, input and elimination have come into balance. Levels can still rise after an injection and fall before the next one. What becomes steady is the repeating pattern.
In a simple linear model, about 94% of the approach to the eventual pattern is complete after four half-lives, and about 97% after five. An eight-day half-life therefore suggests roughly 32–40 days as a teaching estimate. Actual assessment should follow the specific product and clinical plan. Elimination half-life and steady state
There is also direct product information: the Xyosted label, for weekly subcutaneous testosterone enanthate, reports steady state by week six. It calls for trough testing after six weeks of treatment or a dose adjustment. That finding belongs to the weekly autoinjector regimen; it should not be transferred unchanged to every enanthate preparation. Xyosted prescribing information
Steady state and “normal levels” also mean different things. A regimen can settle into a repeating pattern that is still too high or too low for the intended treatment goal. And a suitable concentration doesn't guarantee that fatigue, mood or sexual symptoms have resolved. Those outcomes need their own assessment.
Why frequency changes peaks and troughs
The peak is the high point in a dosing cycle. The trough is the low point, usually assessed just before the next dose. A longer interval leaves more time for the concentration to fall before another dose arrives.
When the same total prescribed amount is divided into smaller, more frequent administrations, each administration adds less and there is less time for levels to fall between them. Under otherwise comparable conditions, this tends to lower peaks and raise troughs. The average exposure can remain similar while the range narrows.
The phrase same total amount is essential. Giving half as much twice as often maintains the same dose rate. Giving the original amount twice as often doubles it. A smaller individual injection does not necessarily mean less treatment overall.
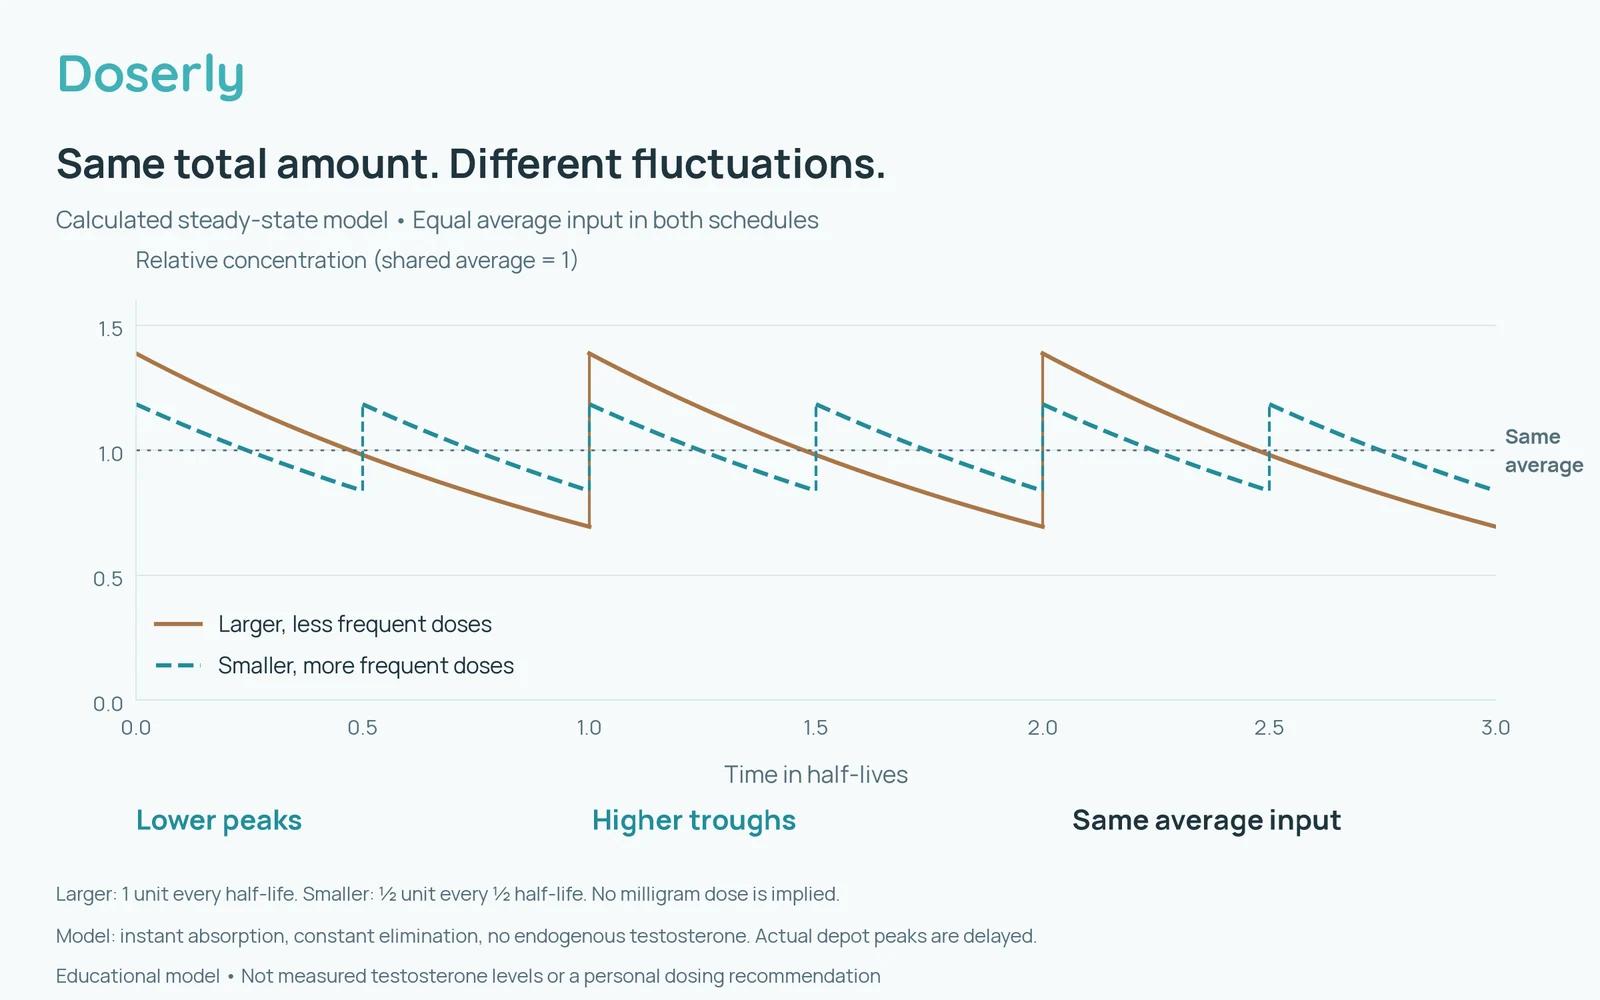
You may see online calculators predicting a very precise curve. Their usefulness depends on the assumptions: half-life, absorption, route, dose history and whether the model includes endogenous testosterone. They can explain the general timing, but their plotted values are not a substitute for a blood test.
Our testosterone cypionate guide and testosterone ester article provide more formulation context.
Can more frequent dosing reduce side effects?
It can be a reasonable clinical strategy when a patient has a reproducible problem across the injection interval. A prescriber might try to reduce a high peak, improve a low trough, or investigate symptoms that repeatedly appear before the next injection. Whether that helps needs to be checked in that person.
One comparative study followed 263 men receiving either 100 mg intramuscular testosterone weekly or 200 mg every other week. At six months, a subgroup analysis found hematocrit above 54% in 1 of 102 men receiving weekly treatment and 4 of 51 receiving treatment every other week. Hematocrit is the proportion of blood volume occupied by red blood cells. Excessive elevation is one reason TRT requires monitoring. Comparative regimen study
This was not a randomized frequency-only trial, and the finding involved few events. The investigators did not find significant between-group differences in the increases in total testosterone, free testosterone, estradiol or PSA. It supports discussing frequency, but cannot establish that twice-weekly or daily injections are progressively safer. Those schedules were not the comparison. Study abstract and results
A smaller peak may be useful; it does not prove that acne, anxiety, fluid retention or breast symptoms will improve. Nor does it show that estradiol will reliably fall. People reporting improvement may also have changed the total dose, route or other medicines. The existing injection-frequency article examines these distinctions more closely.
Testosterone can also raise blood pressure. FDA required class-wide blood-pressure labeling changes in 2025 after reviewing ambulatory monitoring studies. A smoother concentration curve does not remove the need to check blood pressure or hematocrit. FDA labeling communication
The blood-draw time matters
A value measured near a peak answers a different question from one measured near a trough. If an old blood test was taken shortly after treatment and a new one just before the next injection, the numerical change may partly reflect timing.
The Endocrine Society guideline describes measuring testosterone midway between injections for cypionate or enanthate. Xyosted's product instructions instead specify a trough seven days after the most recent weekly dose. These recommendations address different treatment contexts; the appropriate sampling time should be agreed with the prescriber. Endocrine Society guideline, Xyosted label
If injection frequency changes, the blood-draw schedule may need to change too. Keep the actual administration date and time, the sample date and time, and any recent prescription changes with the result. “Tuesday morning” is much more informative when the clinician also knows whether the previous injection was Monday night or the previous Thursday.
Routine steady-state testing is a planned assessment, not a reason to wait through concerning symptoms. A clinician may need to assess a problem earlier, before the regimen has settled.
What happens after the final injection?
Drug exposure declines gradually after treatment stops. In the simple eight-day model, roughly 3% of the starting concentration remains after forty days. Real washout depends on the preparation, accumulated exposure and absorption, so this is an illustration rather than an individual clearance date.
The body's own testosterone production follows a separate process. Exogenous testosterone feeds back on the hormonal signals that support testicular function. Removing the external supply does not instantly restore that signaling or sperm production. Endocrine Society guideline
This is especially important if someone is stopping because of fertility goals. A half-life calculator cannot predict reproductive recovery. Likewise, a side effect does not have to disappear on the same schedule as the drug: a change in blood-cell production, for example, involves more than the concentration on one particular day.
Discussing a planned interruption with the prescriber helps separate three questions: how exposure will fall, what symptoms may need support, and how the original condition or fertility goals will be managed. Stopping, restarting and adding doses in response to a graph can make each of those questions harder to answer.
A useful way to assess a schedule change
Start with the problem you are trying to solve. “I want a flatter curve” is less informative than “my symptoms repeatedly return during the final two days of the interval” or “my hematocrit has risen.” The treatment discussion can then focus on that specific issue.
Before a planned change, clarify whether the total dose, frequency, route or formulation is changing. Agree on when the new pattern should be assessed and when the blood sample should be taken. Record the symptom that matters in a simple, consistent way rather than trying to infer hormone levels from every change in energy or sleep.
Practicality counts too. More frequent injections create more administration events and may be easier for one person but harder for another. Fixed-dose devices, product handling and missed-dose instructions have their own requirements. A schedule needs to work with the actual prescription and supplies.
Half-life makes the timing understandable: doses overlap, levels settle gradually, and the interval influences the size of the fluctuations. The goal of TRT is an appropriate clinical response with acceptable safety and a manageable routine. Frequency can help achieve that goal when it addresses a defined problem and the response is checked.
Sources
- Elimination Half-Life of Drugs, NCBI Bookshelf — general half-life and steady-state principles.
- Testosterone cypionate prescribing information — intramuscular formulation and approximate eight-day half-life.
- Nankin, 1987: Hormone kinetics after intramuscular testosterone cypionate — measured concentration changes in eleven men.
- Xyosted prescribing information — product-specific steady state and sampling instructions.
- Comparative weekly versus every-other-week study, also indexed in PubMed — one study, with laboratory outcomes at six months.
- Endocrine Society clinical practice guideline, 2018 — formulation-specific testing and treatment monitoring.
- FDA class-wide labeling changes, 2025 — blood-pressure findings and labeling action.