
Peptides
October 16, 2026
Why a liver-fat MRI is useful but incomplete
On this page
A liver-fat MRI can show an important change that a bathroom scale cannot. It measures fat within the liver, helping researchers assess whether a treatment is changing one feature of metabolic liver disease. But a lower fat measurement does not, by itself, show that inflammation has resolved, scarring has disappeared or future liver complications have been prevented.
Pemvidutide's early liver studies illustrate both the value and the limits of this measurement. They reported substantial reductions in MRI-measured liver fat over 12 and 24 weeks. Understanding the result requires knowing what the scan measures, how the percentage was calculated, and which people contributed to the follow-up analysis.
If you have encountered a headline about a 70% liver-fat reduction—or a report describing liver fat as “normalized”—the most useful next step is to identify exactly what changed. The Doserly pemvidutide guide covers the broader drug program; this article explains how to read the imaging evidence.
What MRI-PDFF actually measures
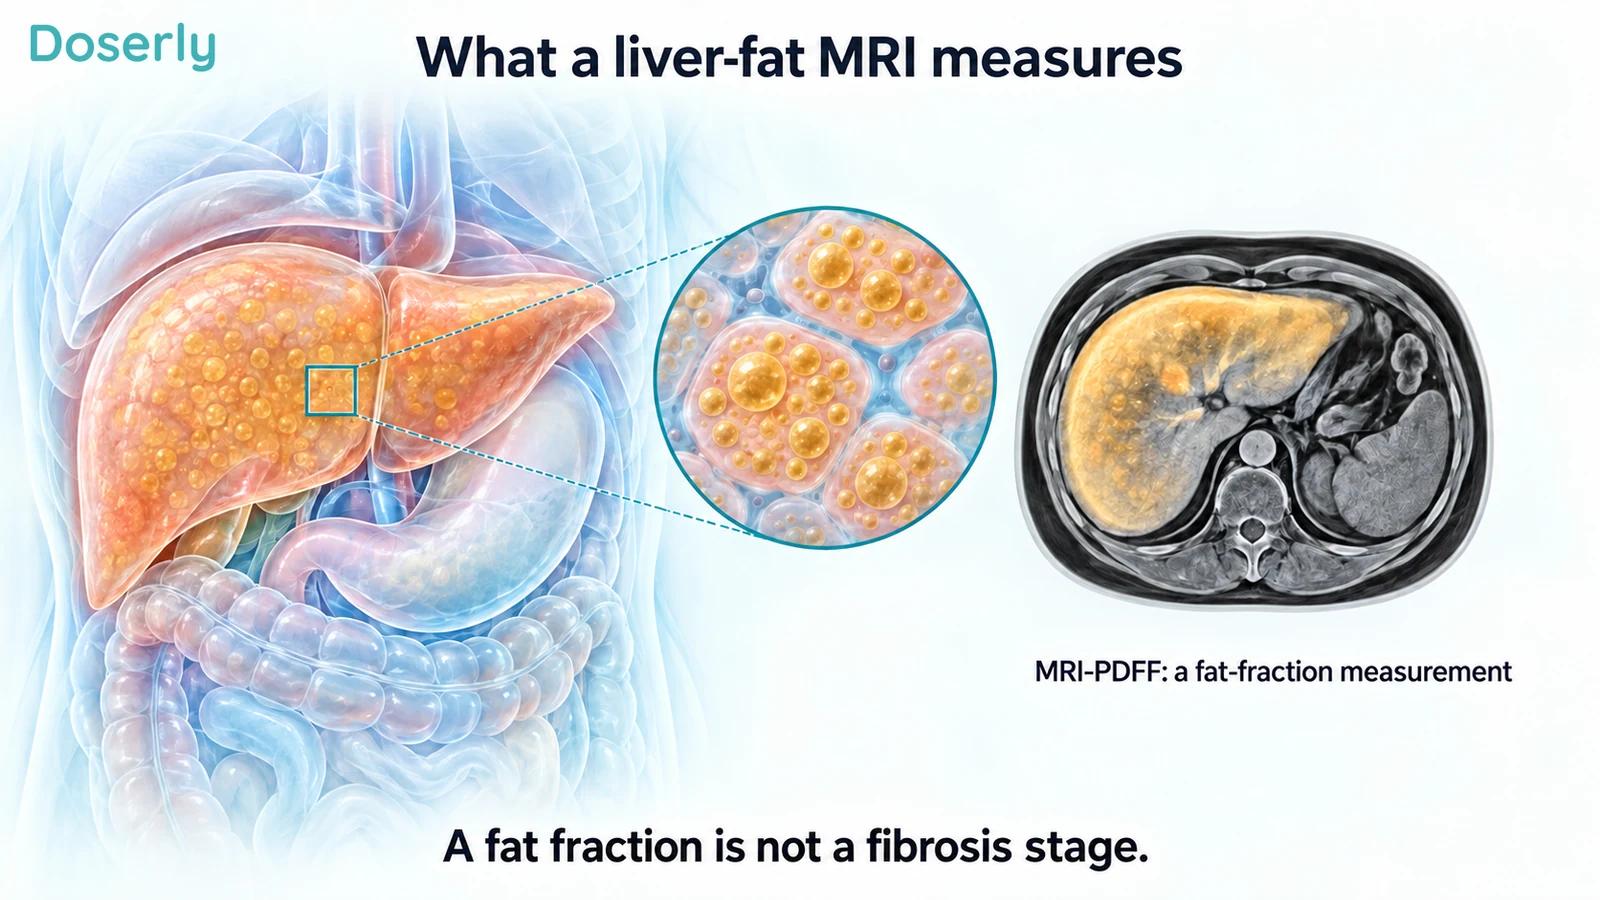
MRI-PDFF stands for magnetic resonance imaging proton density fat fraction. It estimates the contribution of mobile protons associated with fat relative to those associated with fat and water in the measured tissue. The result is expressed as a percentage. It is an imaging measure of tissue composition, not a count of scarred cells or a direct weighing of fat removed from the liver. QIBA liver PDFF profile
The technical term is worth understanding because “liver fat” can refer to different assessments. A routine scan that notes fatty infiltration, an ultrasound-based estimate and a quantitative MRI protocol do not necessarily provide interchangeable numbers. Even when two reports use percentages, the underlying measurement should be checked before comparing them.
MRI-PDFF is particularly useful in research because it produces a quantitative measurement that can be repeated. Researchers can compare a baseline value with a later value and examine the difference between treatment groups. The scan can therefore show a biological response without requiring every question about liver disease to be answered by a biopsy.
That usefulness has a boundary. A well-measured fat fraction remains a fat fraction. Precision does not turn it into a universal liver-health score.
Relative reduction and percentage-point change are different
Suppose an invented patient's liver-fat fraction falls from 20% to 8%. The absolute change is a decrease of 12 percentage points. The relative reduction is 60%, calculated by dividing that 12-point decrease by the starting value of 20%.
Both descriptions are correct, but they communicate different things. “A 60% reduction” sounds very large, yet the final fat fraction is still 8%. It does not mean the liver lost 60 percentage points of fat, and it does not mean 60% of the liver was removed or repaired.
Starting values also affect the result. A 50% relative reduction from 20% leaves 10%. A 50% relative reduction from 10% leaves 5%. The same relative response can therefore end at different absolute values. These examples are arithmetic illustrations, not predictions for an individual or reconstructions of pemvidutide trial participants.
When reading a trial, look for the starting level, the final level or absolute change, and the relative change. A headline may report only one. If the reported figure is a model-adjusted group average, do not assume that applying it to the overall baseline average will reproduce the average final measurement. Group composition and the analysis method can make that shortcut inaccurate.
What the 12-week pemvidutide trial found
The first randomized MASLD trial enrolled 94 people with BMI of at least 28 and MRI-measured liver fat of at least 10%. About 29% had type 2 diabetes. Participants received one of three pemvidutide doses or placebo for 12 weeks. The primary efficacy outcome was relative change in liver fat. Original 12-week trial
Reported relative reductions were 46.6%, 68.5% and 57.1% in the three active-treatment groups, compared with 4.4% with placebo. This established a substantial short-term imaging effect in the population studied. It did not establish an equivalent percentage reduction in scarring or future liver-failure risk. Original 12-week trial
The entry requirement matters. These were people with a meaningful amount of liver fat at baseline, not everyone with any degree of steatosis. Someone starting with a much lower measurement has a different amount available to change. The observed percentage should not be treated as a personal target independent of the starting value.
The study also cannot tell us that the dose with the largest average reduction is the best dose for every patient. Small treatment groups can produce a non-linear pattern, and efficacy needs to be interpreted with tolerability and longer follow-up. The trial doses identify the research groups; they are not an instruction to select or escalate treatment.
The 24-week extension followed a selected group
The extension publication is easy to misread as a second independent trial. It continued treatment in participants from the original study. Of 94 original participants, 83 completed 12 weeks, 66 consented to the extension and 64 met its eligibility criteria. Participants retained their originally assigned treatment. Original extension report
At 24 weeks in total, reported relative liver-fat reductions were 56.3%, 75.2% and 76.4% in the active groups, compared with 14.0% with placebo. The findings supported continued imaging improvement during longer treatment. The authors reported that people declining the extension had similar initial responses and mainly cited scheduling conflicts, which is useful context for the selection issue. Original extension report
That context does not make selection disappear. A continuation study describes people who reached the end of the first period and entered the next one. It does not automatically estimate what would happen to every person who started the original treatment, including those who stopped earlier.
The correct time description is also important: 24 weeks total, consisting of the initial 12 weeks plus a further 12 weeks. It is not 24 additional weeks after the original trial. Keeping the cohort and calendar clear prevents an exaggerated impression of both the amount of evidence and the treatment duration.
“Normalized liver fat” is a threshold result
The extension defined normalization as a measured liver-fat fraction of 5% or less. It reported that 53.8% of participants evaluated at the middle dose met that threshold. This describes an imaging category. It does not establish that every dimension of liver disease was normal. Original extension report
A threshold turns a continuous measurement into a yes-or-no outcome. Two people with values just above and just below the cutoff may be classified differently despite having similar measurements. The threshold can still be useful for research, but the classification should be read with the actual value and the broader clinical picture.
It is especially important not to translate “normalized fat” into “cured MASH” or “no fibrosis.” Those statements require different evidence. The reassuring wording attached to a scan can otherwise lead someone to dismiss a previous fibrosis diagnosis or stop asking about follow-up.
The question for a care team is not merely whether a value crossed a line. It is what the change means alongside the person's starting disease, other tests, symptoms and ongoing risk factors.
Fat, inflammation and fibrosis are related—not interchangeable
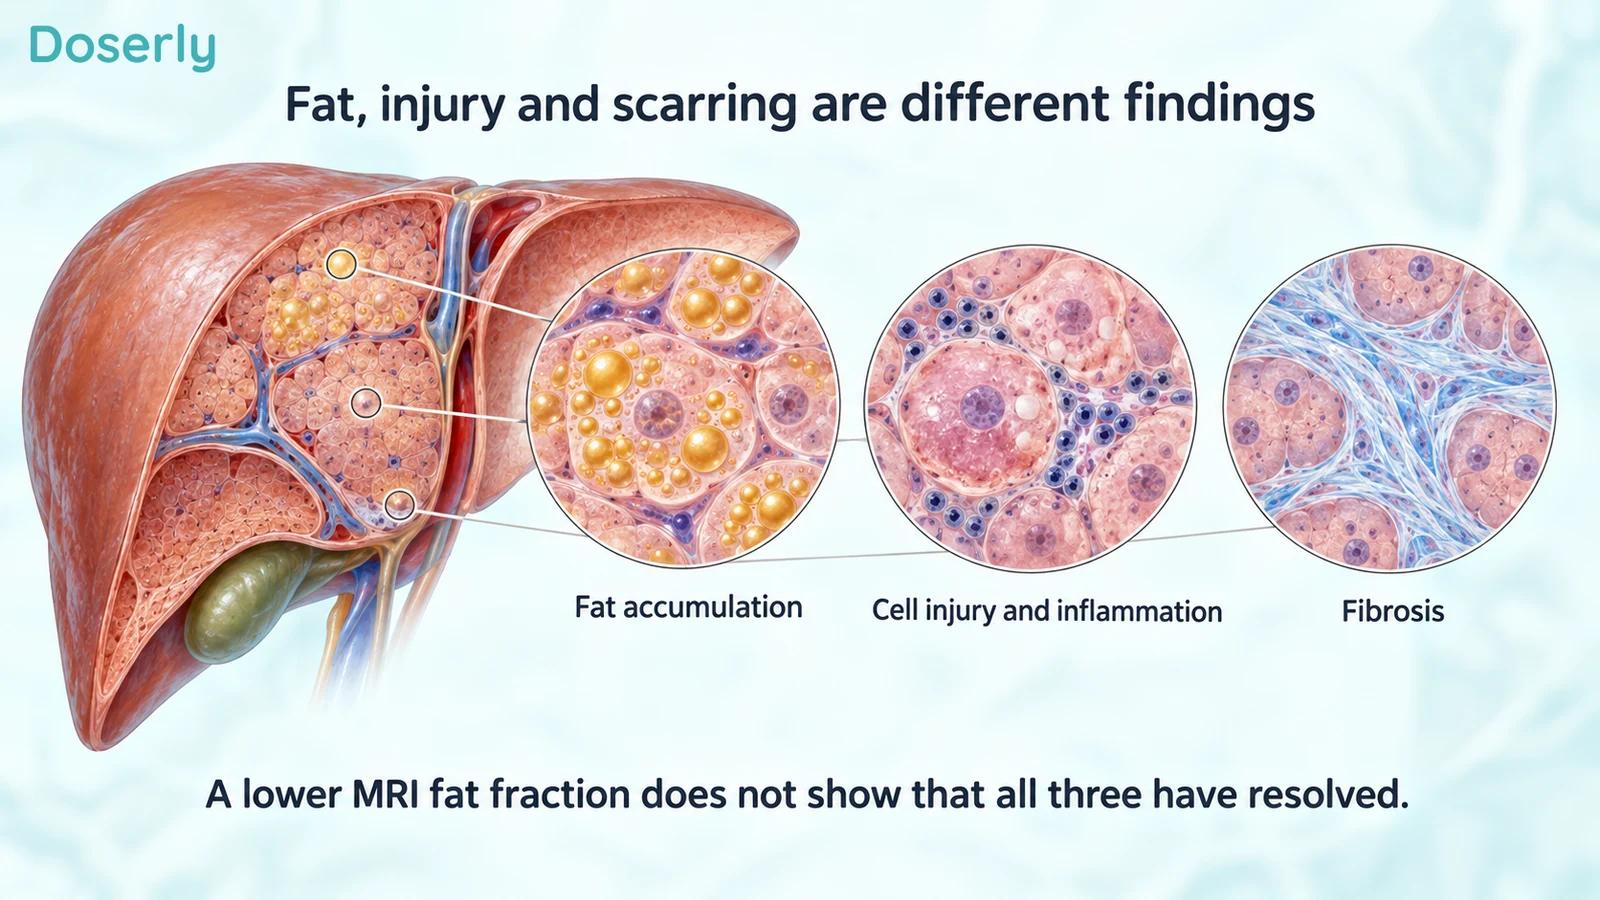
Metabolic dysfunction-associated steatotic liver disease includes excess liver fat in a metabolic context. MASH adds a pattern of liver-cell injury and inflammation. Fibrosis describes scar formation. These features are related, but a test directed at one feature does not fully measure the others. AASLD practice guidance
This distinction explains why several measurements can improve by different amounts. A fat fraction may fall substantially while a fibrosis stage remains unchanged. A blood marker can shift without a corresponding change in a biopsy category. Such findings are not automatically contradictory; the tests observe different aspects of disease on different scales.
Biopsy also has limitations, including the fact that it samples tissue rather than examining every part of the liver. Recognizing those limitations does not make MRI fat fraction a replacement for all histological questions. It explains why researchers often use several complementary measurements and prespecify which one answers the main question.
The best interpretation avoids two extremes: treating an MRI improvement as a complete recovery, or dismissing it because it is not a biopsy. A reproducible reduction in liver fat can be a meaningful research finding while additional disease features remain to be assessed.
Other tests answer different questions too
ALT and AST are blood enzymes used in liver assessment. Lower values can support a favorable overall picture, but normal aminotransferase values do not reliably exclude clinically significant fibrosis. AASLD specifically cautions against using them alone to rule out advanced disease. AASLD practice guidance
Elastography assesses liver stiffness. MRI-PDFF assesses fat fraction. An MRI-based tissue measure called corrected T1, or cT1, is another assessment again. Sharing an imaging platform does not make the measurements interchangeable, and a change reported in milliseconds is not a fat percentage or a fibrosis stage.
The pemvidutide extension included a small cT1 subset and several blood-based markers. Its authors reported that significant changes in ELF and Pro-C3 were not observed in this population, which had been selected for absence of marked fibrosis. A report should preserve these distinctions rather than describing every marker as improved. Original extension report
A useful clinical report therefore identifies each test by name, unit and purpose. “The liver tests improved” is too broad when the practical concern is whether scarring has changed.
The later biopsy trial tests the limits directly
IMPACT moved into people with biopsy-confirmed MASH and F2 or F3 fibrosis. Its 24-week results favored pemvidutide for MASH resolution without worsening fibrosis, but did not establish a statistically significant benefit on the separate primary endpoint of fibrosis improvement without worsening MASH. Original IMPACT report
That is not a reason to disregard the early MRI findings. It is evidence that an imaging response and a successful fibrosis endpoint are different achievements. The biological change measured early in development did not guarantee every later result.
The sponsor's 48-week IMPACT report described noninvasive follow-up, including liver fat and stiffness. Those findings extended the observation period for those measurements; they were not another biopsy result at 48 weeks. 48-week sponsor report
The distinction remains important even when results from several tests point in a favorable direction. Evidence of less liver fat, a better blood marker and a favorable biopsy outcome may support one another, but they should not be merged into an unmeasured outcome such as prevention of liver transplantation.
Consistent measurement makes follow-up more useful
Quantitative MRI is not independent of technique. The QIBA profile addresses scanner acquisition, reconstruction, analysis and quality assurance to reduce unnecessary variability. It recommends comparable liver regions across time points and avoiding structures such as major vessels in the analysis. QIBA liver PDFF profile
For a patient, that does not mean personally checking scanner settings. It means asking whether two reported numbers are comparable and whether a small change is meaningful under the measurement conditions. A difference between scans can reflect biology, measurement variation or both.
It also means that every scan need not be repeated merely because a study used serial MRI. Clinical follow-up should answer a question that affects care. A clinician may choose other assessments based on the person's existing results and risk, rather than reproducing a research protocol.
What to ask about your own result
The most useful questions are specific: Was this a quantitative fat-fraction measurement? What were the previous and current values? Was the reported change relative or absolute? What do the other results say about fibrosis risk, and would any additional test change management?
Bring the actual reports when possible. A remembered statement such as “fat went down 70%” leaves out the baseline, the final value and the method. Those details can change the interpretation substantially.
A favorable liver-fat MRI is worth understanding and can be encouraging. Its proper role is as one measurement within a broader assessment. Pemvidutide's studies demonstrate why that measurement is useful for developing treatments—and why a complete account of liver health still needs more than one number.
Explore the research
- QIBA MRI-PDFF liver profile — measurement definition and technical consistency.
- 12-week pemvidutide MASLD trial — initial randomized imaging results.
- 24-week extension — selected continuation cohort and multiple liver measures.
- AASLD practice guidance — complementary assessment of steatosis and fibrosis.
- IMPACT primary report — separate biopsy outcomes.
- 48-week IMPACT sponsor report — later noninvasive follow-up, not a new biopsy endpoint.