
Peptides
October 16, 2026
Why Humanin blood levels are hard to compare between studies
On this page
A Humanin result can look reassuringly precise: a number, a unit and a difference between groups. Yet two papers reporting “Humanin levels” may have measured different sample types, with different antibodies, in people selected for very different reasons. Putting those numbers on one scale can create a comparison neither study actually made.
This does not make the research useless. It changes the appropriate question from “Which number is ideal?” to “What was measured, in whom, and under what conditions?” Those details determine whether a result can be compared with another study, interpreted as a biological signal, or used in an individual’s care.
The Humanin guide covers the wider peptide research. This article focuses on the measurement problem: why an emerging research marker should not be treated as a universal mitochondrial-health score.
Start with the material in the tube
In a 2013 coronary study, researchers examined 40 people undergoing coronary angiography and endothelial-function testing. They collected aortic plasma during catheterization and found lower circulating Humanin in the group with impaired coronary endothelial function. This was a clinical association in a selected cardiac population, not a survey establishing normal levels in the general public. Coronary endothelial-function study.
Compare that setting with a 2019 diabetes study. Its methods specify serum Humanin measured with a commercial ELISA kit. The study included control, prediabetes and type 2 diabetes groups, and the authors reported random sample collection rather than a standardized fasting assessment. Diabetes study methods.
Plasma and serum are related blood-derived materials, but they are prepared differently. Plasma is separated from anticoagulated blood; serum is obtained after clotting. A method validated for one should not automatically be assumed interchangeable with a method used for the other. “Blood Humanin” is convenient shorthand, but it omits information needed for a serious comparison.
Collection site and setting also deserve attention. A sample obtained during cardiac catheterization has a different clinical context from a routine outpatient blood draw or a sample taken after exercise. That does not prove the setting caused a particular difference. It means the context must remain visible rather than disappearing when numbers are copied into a summary table.
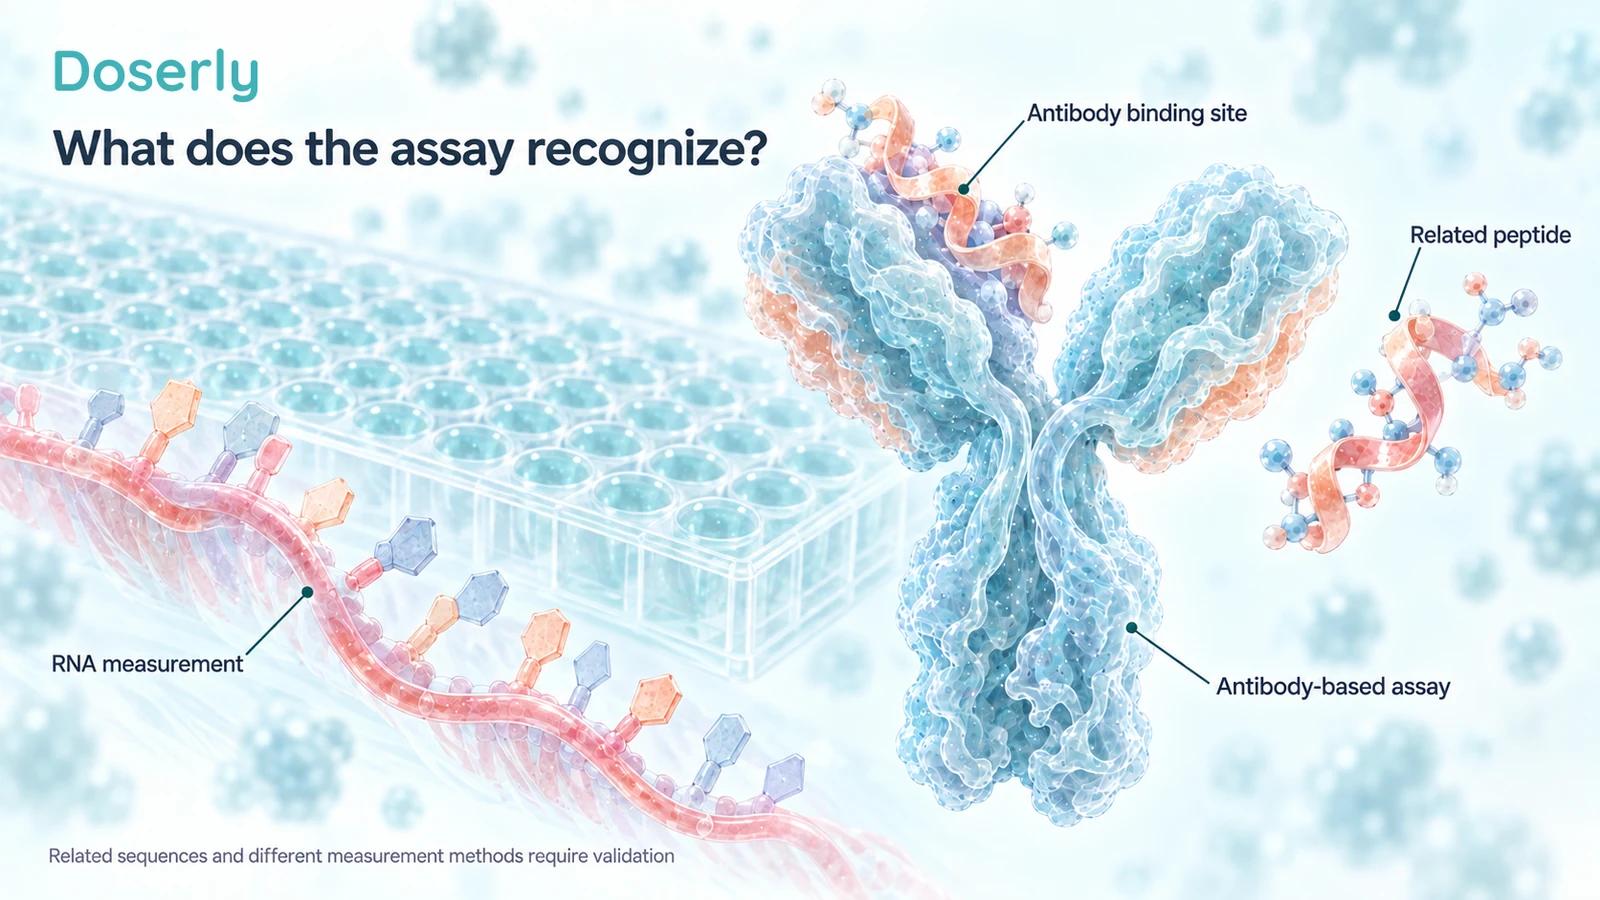
Antibody assays and RNA measurements answer different questions. The molecular forms are conceptual, and the illustration does not claim that every related peptide cross-reacts with every assay.
An ELISA result depends on what the antibodies recognize
An enzyme-linked immunosorbent assay, or ELISA, uses antibody recognition to generate a measurable signal. The reported concentration is therefore tied to a particular assay and its calibration. Calling two methods “ELISA” does not demonstrate that they detect exactly the same molecular material with the same accuracy.
Humanin makes this especially relevant because there are related sequences. A 2009 study reported nuclear loci with the potential to encode Humanin-like peptides and expression of several corresponding genes in human tissues. That finding does not establish how much each form contributes to every blood sample, but it makes specificity a substantive question. Nuclear Humanin-like isoform study.
Researchers need to know whether an antibody recognizes the intended intact peptide, related sequences, fragments, or some combination. The answer cannot be inferred from the product name alone. Demonstrating that an assay gives a repeatable reading is helpful, but repeatability and molecular specificity are different properties.
A useful analogy is a consistently calibrated counter that cannot distinguish two similar objects. Repeating the count may be precise while still answering a broader question than intended. For Humanin, the scientific task is to establish what is being counted before interpreting the result as a unique readout of mitochondrial peptide production.
This is a reason to seek validation data, not to declare all existing measurements invalid. Cross-reactivity must be demonstrated or excluded for the actual reagents. It should not be presumed simply because related sequences exist, and it should not be ignored because a kit is commercially available.
RNA expression is not circulating peptide concentration
A 2021 mouse study of the nuclear Humanin-like gene Gm20594 illustrates another measurement challenge. The investigators examined gene expression with attention to reverse-transcription primers and mitochondrial-content normalization. They also discussed how related sequences and the ribosomal-RNA context complicate detection. This was mouse gene-expression research, not a validated human blood test. Gm20594 expression study.
An RNA assay asks about a transcript. A peptide assay asks about protein material recognized by its detection method. The two may be biologically connected, but they are not numerically interchangeable. A transcript increase does not by itself state how much intact peptide is present in plasma, how much is secreted, or what biological activity follows.
A 2025 Alzheimer’s-related case-control study makes the distinction concrete. It reported differences in Humanin and MOTS-c transcript measurements, while circulating protein concentrations did not distinguish Alzheimer’s disease from mild cognitive impairment. Describing the entire finding simply as “low Humanin” would conceal which measurement carried the signal. Transcript and protein biomarker study.
The denominator matters too. Gene expression normalized to a reference gene or mitochondrial DNA content is a relative measurement. It cannot be converted into picograms of circulating peptide by changing the axis label. Before comparing studies, the first task is to identify whether both are measuring the same kind of quantity at all.
Blood does not report every tissue’s response
A resistance-training study in men with impaired glucose regulation found increased Humanin protein in sampled skeletal muscle after training, without a matching increase in circulating serum Humanin. The tissue and blood findings belonged to the same exercise program but did not move together. Resistance-training study.
That result is especially useful because it challenges a common assumption: if something changes inside muscle, a blood test must reveal it. A tissue measurement samples a local biological compartment. A blood concentration reflects what reaches and remains in the sampled circulation. Those are related possibilities, not equivalent observations.
The reverse inference is also unsafe. A higher blood value does not identify which tissue produced it or prove that a particular organ has more effective protective signaling. A blood sample is not a map of all the body’s mitochondria. Identifying a source tissue requires additional evidence rather than an anatomical illustration or a plausible story.
For someone following exercise research, this changes the interpretation of a “negative” blood result. It may mean there was no detected change in that circulating measurement under those conditions. It does not automatically mean that no local adaptation occurred. Equally, a positive blood result does not establish improved strength, endurance or health without those outcomes being assessed.
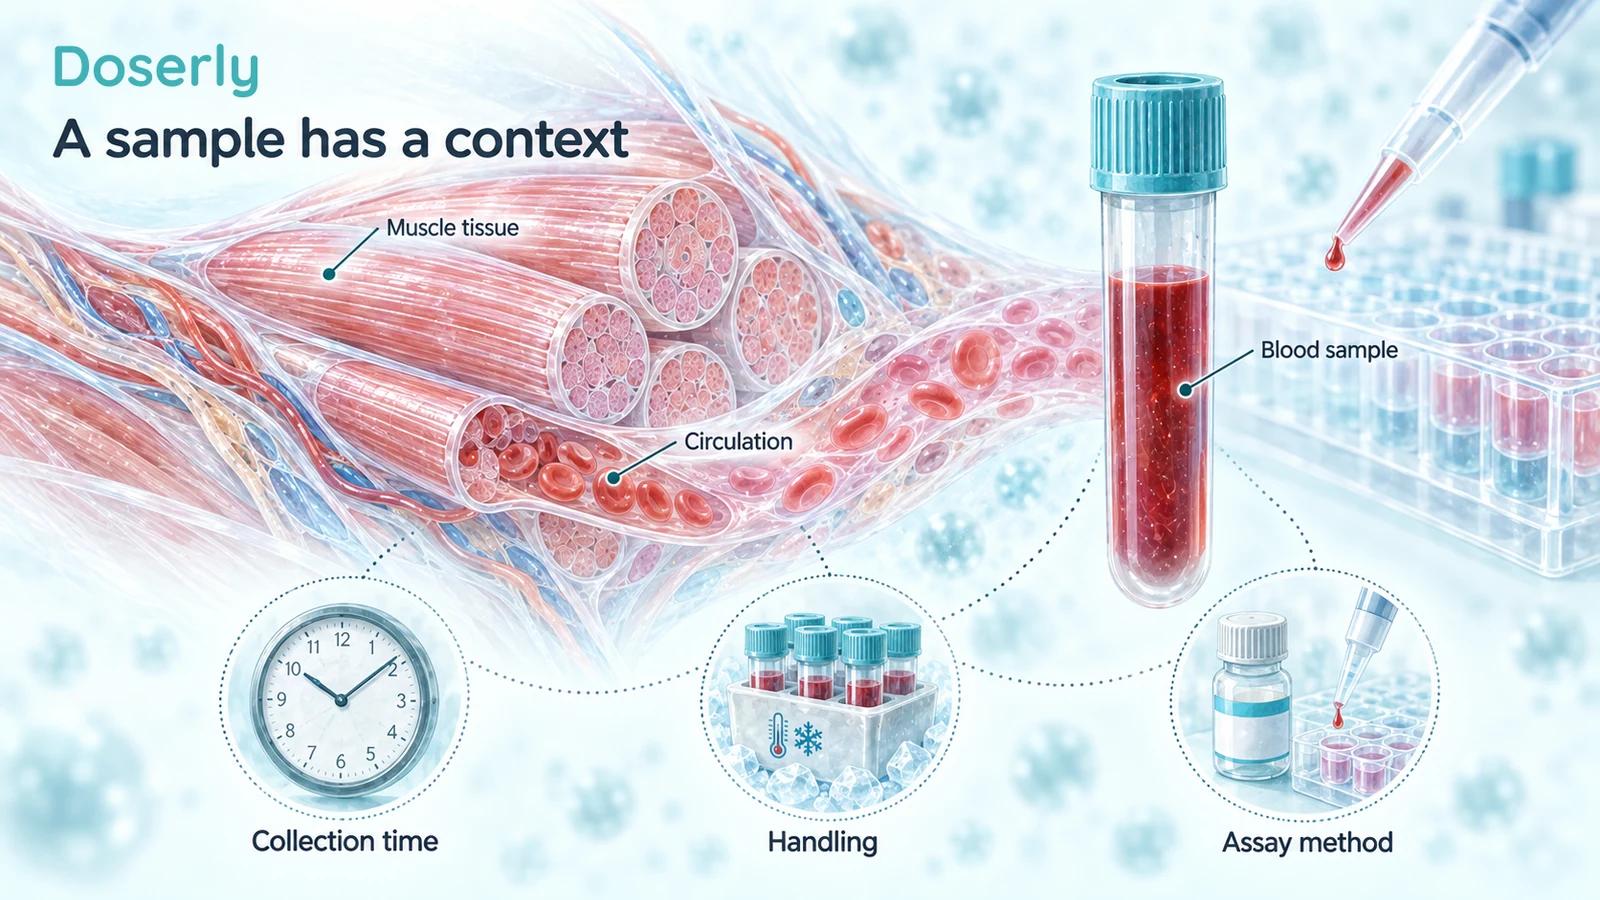
The tissue, sampling time, handling and assay all belong to the result. These are measurement contexts, not a proposed Humanin treatment pathway.
Timing can change the question being asked
An acute-exercise study published in 2021 sampled participants before and after endurance exercise, resistance exercise or a control condition. It reported an increase in circulating Humanin after endurance exercise. That experiment concerns a response around a defined bout of activity; it does not establish a resting target concentration for every active person. Acute-exercise study.
A sample collected shortly after a physiological challenge may answer a different question from one collected after rest. The comparison needs to state which question it intends to answer. Is the goal to measure a stable baseline, the size of an acute response, or recovery toward baseline? Combining these as though they were identical can turn timing into apparent disagreement.
Handling belongs in the same conversation. For a proposed marker, researchers should report collection procedures, processing, storage and assay conditions sufficiently clearly for another laboratory to reproduce the work. This is a requirement for interpreting comparability; it is not a claim that every handling difference has already been shown to alter Humanin by a known amount.
Population differences can be biological, not just technical
A study of aging and longevity included adults across a wide age range and reported higher mitokine levels at older ages, with less favorable associations in the oldest participants. Other Humanin research has emphasized lower levels in particular disease groups or favorable associations in selected longevity families. The age study alone shows why “higher is always healthier” is too simple. Human aging and mitokines.
Different populations can differ in illness burden, medications, activity, age distribution and selection criteria. A study recruiting unusually healthy volunteers is not sampling the same mixture of people as a study recruiting patients from a specialty clinic. Statistical adjustment may address some measured differences; it does not make every population identical.
There is also more than one possible biological interpretation of a concentration. A high value might reflect greater production, altered removal, or a response to stress. A low value might accompany disease without being the cause of it. These are hypotheses to test, not established explanations for every result. The direction of an association cannot settle which explanation applies.
The distinction matters when a result is used commercially. A number described as “below the healthy range” may actually be below the mean of one small research control group. A group mean is not a clinical reference interval, a diagnostic threshold, or a treatment target. Those require separate development and validation.
Check units and the original results
Picograms and nanograms differ by a factor of 1,000: 1 ng/mL equals 1,000 pg/mL. Converting units is necessary before comparing concentrations, but it does not solve differences in samples, assays or populations. A correct unit conversion can still produce a biologically misleading comparison.
The 2016 impaired-fasting-glucose paper offers another reason to check the full results. Its abstract pairs the numerical values with group labels in a way that conflicts with the stated decrease. Table 2 and the results text instead place the lower value in the impaired-fasting-glucose group. The study analyzed 81 participants using a commercial plasma assay. The table is therefore essential for interpreting the direction correctly. Primary paper and Table 2.
That is a specific reporting inconsistency, not evidence that the entire study should be discarded. It does show how an error can spread when an abstract is copied without checking the underlying result. For a patient-facing explanation, omitting an unnecessary numerical comparison is preferable to presenting an unresolved number confidently.
What would make a Humanin result clinically useful?
A useful test would need a defined intended use. Predicting a future outcome, distinguishing two diagnoses, and monitoring a treatment response are different jobs. Each requires a suitable population, a reliable method and evidence that the result helps make a better decision.
For comparisons across laboratories, the same samples could be tested with different methods to establish agreement and identify systematic differences. For individual interpretation, studies would need to characterize ordinary variation and define what constitutes a meaningful change. For treatment monitoring, a change in the marker would need a demonstrated relationship to an outcome people care about.
Until that work supports a particular application, a Humanin value is best read within the study that produced it. Record the sample type, assay, units, participant group, timing and measured outcome before carrying the conclusion elsewhere. That approach preserves the signal in the research without converting an emerging biomarker into an unsupported personal health score.
Sources
- Widmer et al., 2013: coronary endothelial function.
- Ramanjaneya et al., 2019: diabetes cohort and serum assay methods.
- Bodzioch et al., 2009: nuclear Humanin-like isoforms.
- Kim et al., 2021: mouse Gm20594 expression methods.
- Rodríguez-Esparragón et al., 2025: transcripts and proteins.
- Gidlund et al., 2016: muscle versus serum after training.
- Acute endurance exercise study, 2021.
- Conte et al., 2019: aging and mitokines.
- Voigt and Jelinek, 2016: impaired fasting glucose, Table 2.