
Peptides
October 16, 2026
Petrelintide's early weight result: what 8.6% means
On this page
An average weight reduction of 8.6% over sixteen weeks is enough to attract attention. It suggests more than a small day-to-day fluctuation, and it helped make petrelintide an interesting candidate for further obesity research. But the number becomes useful only when we know what was measured and how many people contributed to it.
Petrelintide is a long-acting analogue of amylin, a hormone involved in meal-related appetite signalling. Its early human studies examined safety, tolerability and drug exposure, while also measuring body weight. The 8.6% figure came from one small repeated-dose cohort, not from every participant in the development program.
A small trial can detect a substantial treatment signal. Smallness doesn't make the result false. It does make the estimate more vulnerable to individual variation and leaves many clinical questions unanswered. Here is how to read this particular finding, including the larger evidence that followed.
Where did the 8.6% figure come from?
The published phase 1 report describes two trials with several parts. The single-dose study and a shorter repeated-dose portion were mainly early exposure and safety investigations. The sixteen-week portion enrolled 48 adults with overweight or obesity who were otherwise healthy.
Participants entered three sequential cohorts. Each included 12 people receiving petrelintide and four receiving placebo, with placebo participants pooled into a group of 12 for analysis. The active groups escalated toward different maintenance doses. Observed mean weight reductions at sixteen weeks were 4.8%, 8.6% and 8.3%, compared with 1.7% in the placebo group. Phase 1 publication
The 8.6% result therefore describes the middle target-dose cohort's observed mean change. It isn't the average for all 133 people randomized across the two trials, and it isn't the fraction of participants who lost weight.
That distinction is easy to miss when a headline combines the total study enrollment with the largest result from one subgroup. The trial's overall participant count and the denominator behind a particular estimate are different pieces of information.
What does a percentage of body weight mean?
Weight change is expressed relative to starting weight. For an illustrative person beginning at 100 kg, an 8.6% reduction corresponds to 8.6 kg. For a different starting weight, the same percentage corresponds to a different number of kilograms. This example explains the arithmetic; it isn't an individual result from the trial.
A group mean is also not a target everyone reached. Some participants can lose more and others less, and a mean doesn't reveal how evenly the changes are distributed. To understand that variation, researchers report additional information such as individual responses, spread and uncertainty.
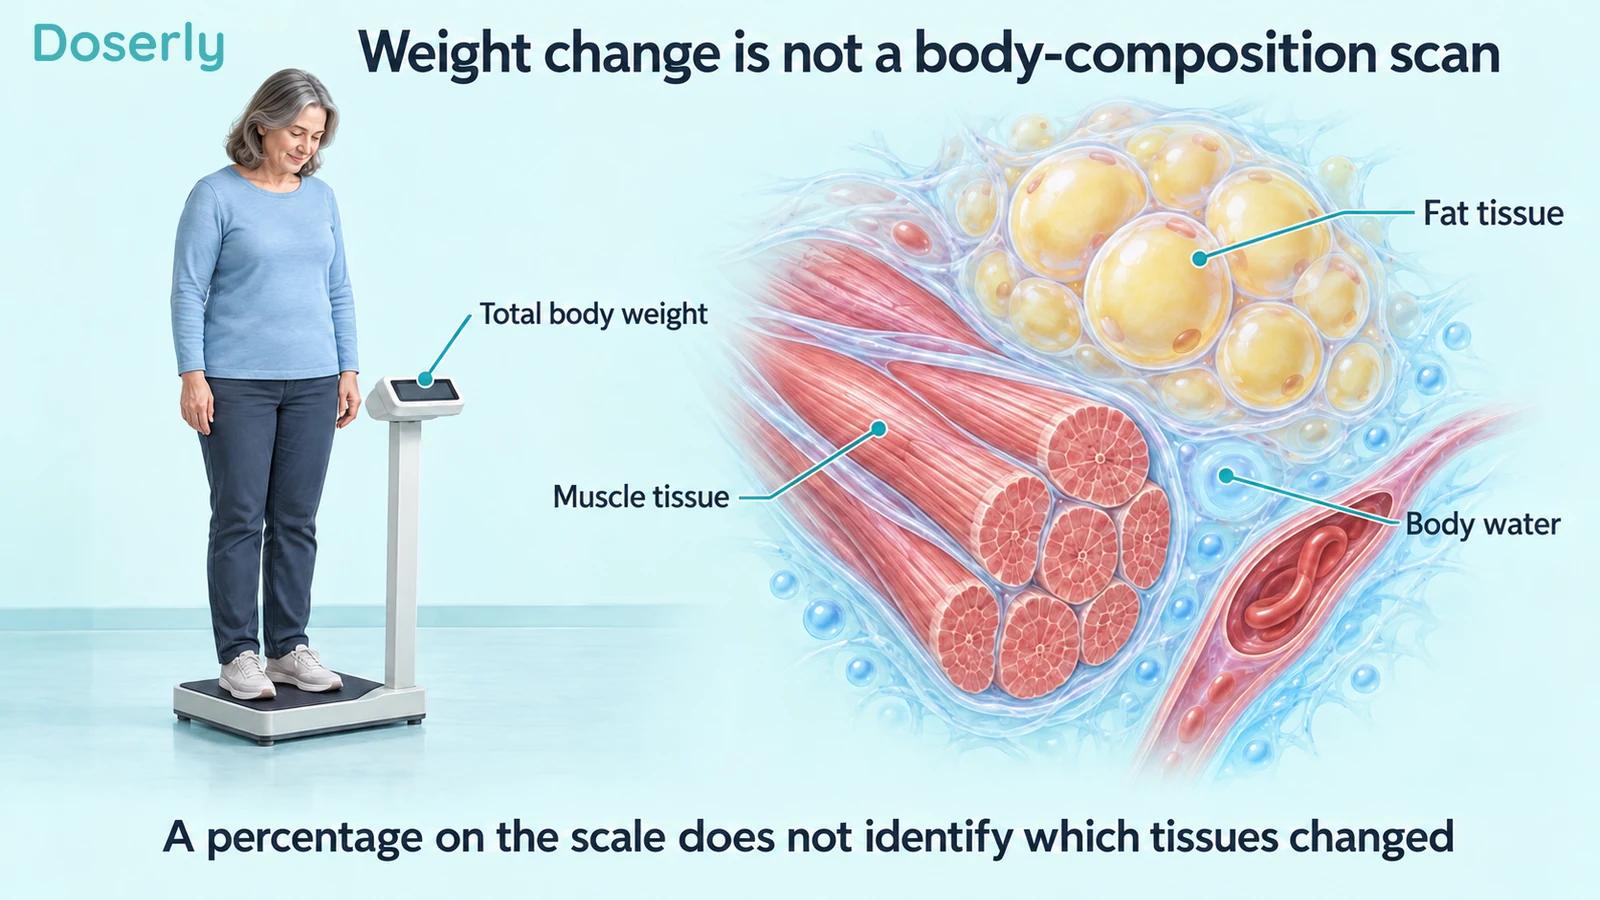
The percentage concerns total body weight. It doesn't identify how much change came from fat, lean tissue or water. A claim about preserving muscle would need a suitable body-composition assessment and, ideally, measures of muscle function. A scale cannot provide those answers by itself.
Why keep the placebo result beside the active result?
The placebo group lost an average of 1.7% over the same period. That matters because trial participation, changes in behavior, measurement variation and other influences can affect weight even without the active drug.
Subtracting the reported observed means gives 8.6 minus 1.7, or 6.9 percentage points. This is a simple descriptive contrast. The publication also reports a model-based estimated difference of approximately 7.0 percentage points for that cohort, using a post hoc repeated-measures analysis. The two values arise from different calculations and rounding. Phase 1 weight analysis
Neither should be called “an 8.6% benefit over placebo.” The 8.6% is the active group's reduction from baseline. The contrast with placebo is smaller because the comparator group also lost weight.
This isn't a technicality that removes the result's interest. It gives the treatment effect an appropriate reference point. If an intervention changes an outcome, the controlled comparison helps estimate how much more changed than would have changed under the study's control conditions.
Why can a few people influence an early average?
With 12 active participants in a cohort, each person contributes substantially to the group's observed experience. A participant with an unusually large change can move the average more than the same participant would in a group of several hundred.
Randomization helps protect against systematic treatment selection, but it cannot guarantee that tiny groups match on every characteristic. Baseline weight, age and other features may differ by chance. Statistical adjustment can address specified differences; it cannot create the information that a much larger sample would provide.
The same issue is visible in symptom percentages. In a group of 12, one person represents about 8.3 percentage points. That is why readers benefit from seeing counts rather than assuming that a percentage with a decimal place is highly precise.
Precision and size of effect are separate. A large observed difference can be real while the best estimate of its exact size remains uncertain. The appropriate response is a larger study, rather than automatically dismissing or accepting the most striking number.
Did the highest target dose work best?
Not in a simple numerical ordering of the observed sixteen-week means. The middle target-dose cohort had the 8.6% reduction, while the highest target-dose cohort had 8.3%.
That doesn't prove that the middle dose was optimal. The groups were small, and they spent different amounts of time at their maintenance targets: the report describes twelve, eight and six weeks at target across the three cohorts. Total exposure, escalation and participant variation all complicate the comparison. Phase 1 schedule and results
The useful conclusion is that the early study supported further dose finding. It did not establish a personal dose-selection rule. Later trials can test candidate schedules in larger groups and evaluate whether additional exposure adds benefit, adverse effects or little of either.
This is particularly important for a long-acting molecule. A nominal weekly dose is only one part of exposure; accumulation and time at that dose also matter.
How did withdrawals affect the interpretation?
Three petrelintide participants discontinued treatment in the sixteen-week portion: two for personal reasons and one because of gastrointestinal symptoms. All placebo participants completed that portion. In a small cohort, a few incomplete trajectories deserve attention. Participant flow in the phase 1 report
Stopping treatment and leaving a study are not always the same thing. A participant may stop receiving the drug but continue providing measurements. Conversely, a missing endpoint may leave uncertainty even when the reason for leaving seems unrelated to side effects.
The analysis must specify how it handles those situations. Does it describe measurements actually observed? Estimate what would happen under continued treatment? Attempt to include outcomes after stopping? These questions are formalized through the estimand framework used in clinical research. FDA guidance on estimands
A statistical model can use available information to estimate missing outcomes under assumptions. It cannot directly observe a result that was never measured. Sensitivity analyses examine how conclusions change when reasonable assumptions differ.
Why does the primary purpose of the study matter?
The early trials' primary objective was safety and tolerability. Weight was a pharmacodynamic outcome: a measure of what the drug does to the body. The investigators used the findings to decide whether and how to proceed with development.
That makes the weight result informative without turning the study into a definitive obesity-outcomes trial. The publication reports no formal sample-size calculation for a confirmatory weight comparison and identifies its model-based weight analysis as post hoc. Phase 1 methods
“Post hoc” means the analysis was conducted after the original planning stage. Such analyses can be useful, but they deserve a different level of confidence from a successful prespecified main analysis designed around a clearly defined question.
For a reader interested in treatment, the early study helps establish that a biological effect is plausible in humans. It doesn't establish long-term maintenance, improvement in daily function or prevention of obesity-related complications.

Did the larger study support the early signal?
Yes, in the specific sense that the later randomized trial also found greater weight reduction with petrelintide than placebo. ZUPREME-1 randomized 493 adults, with 485 receiving at least one dose. Its registration identifies a dose-finding phase 2 study, and its primary weight endpoint was prospectively set at week 28. Trial registration
The September 2026 publication reported efficacy-estimand weight reductions of 7.9%–9.8% across active groups at week 28, compared with 1.7% for placebo. Weight continued to decline through week 42, with a maximum reported group mean reduction of 10.7%. Primary phase 2 publication
That is stronger evidence than the early cohort alone. It also shows why the early number should not be multiplied into a longer-term forecast. Weight trajectories need observation; a sixteen-week percentage doesn't imply a constant weekly rate that continues indefinitely.
The later study isn't a literal replication of the early protocol. It used different doses, escalation and participants. Its value is that a larger, planned study supported a weight effect under its own conditions.
Why do later reports give more than one percentage?
The September company update reported up to 10.7% reduction at week 42 under the efficacy estimand and up to 10.2% under the treatment-policy estimand. The accompanying placebo figures also differed between analyses. September publication update
Those estimates address different treatment questions. They should retain their labels rather than being presented as conflicting measurements or selectively chosen to make one medicine look better.
The same discipline applies to newer diabetes results. The October ZUPREME-2 topline announcement described up to 9.2% reduction at 28 weeks versus 2.0% with placebo in adults with type 2 diabetes. That was a different population and, at this check, a sponsor summary awaiting fuller reporting. ZUPREME-2 announcement
It would be misleading to call a smaller percentage in that trial a deterioration in the molecule. The population, duration and clinical question differ.
What is the fair interpretation of the early result?
The 8.6% finding was an encouraging signal from a small, intensively observed cohort. Its usefulness came from the controlled design, documented exposure and accompanying safety observations. Its limits came from the small groups, short duration, exploratory weight analysis and selected participants.
The later phase 2 publication makes the story more substantial, but the goal remains to understand outcomes people can sustain. That includes tolerability, nutrition, function and the consequences of stopping, alongside changes on the scale.
When you encounter the early percentage, keep three details attached to it: sixteen weeks, a small dose cohort, and a 1.7% placebo reduction. Then look to the larger studies for the next part of the answer. Our petrelintide guide places these findings within the wider development program.
Sources
- Published phase 1 trials.
- ZUPREME-1 primary publication.
- ZUPREME-1 registration.
- FDA estimands and sensitivity-analysis guidance.
- September ZUPREME-1 update.
- October ZUPREME-2 topline results.