
Peptides
October 16, 2026
Tesamorelin and glucose: why less abdominal fat does not settle safety
On this page
Tesamorelin can reduce fat deep inside the abdomen in people with HIV-associated lipodystrophy. That is a meaningful effect for someone whose fat distribution has changed. It is also understandable to expect better blood-sugar control when that fat decreases. The clinical findings are more complicated: a favorable scan does not tell you everything about glucose.
The question is especially relevant if you already have prediabetes or diabetes, or if someone has described tesamorelin as a general metabolic treatment. The studies examine different groups, different periods of treatment and different kinds of glucose result. Some look at average laboratory changes; others count people who cross a diabetes threshold. Those results can point in different directions without either being wrong.
This article explains how they fit together and what information makes a treatment discussion more useful. Our tesamorelin guide provides the broader background on the medicine and its uses.
What does losing visceral fat actually mean?
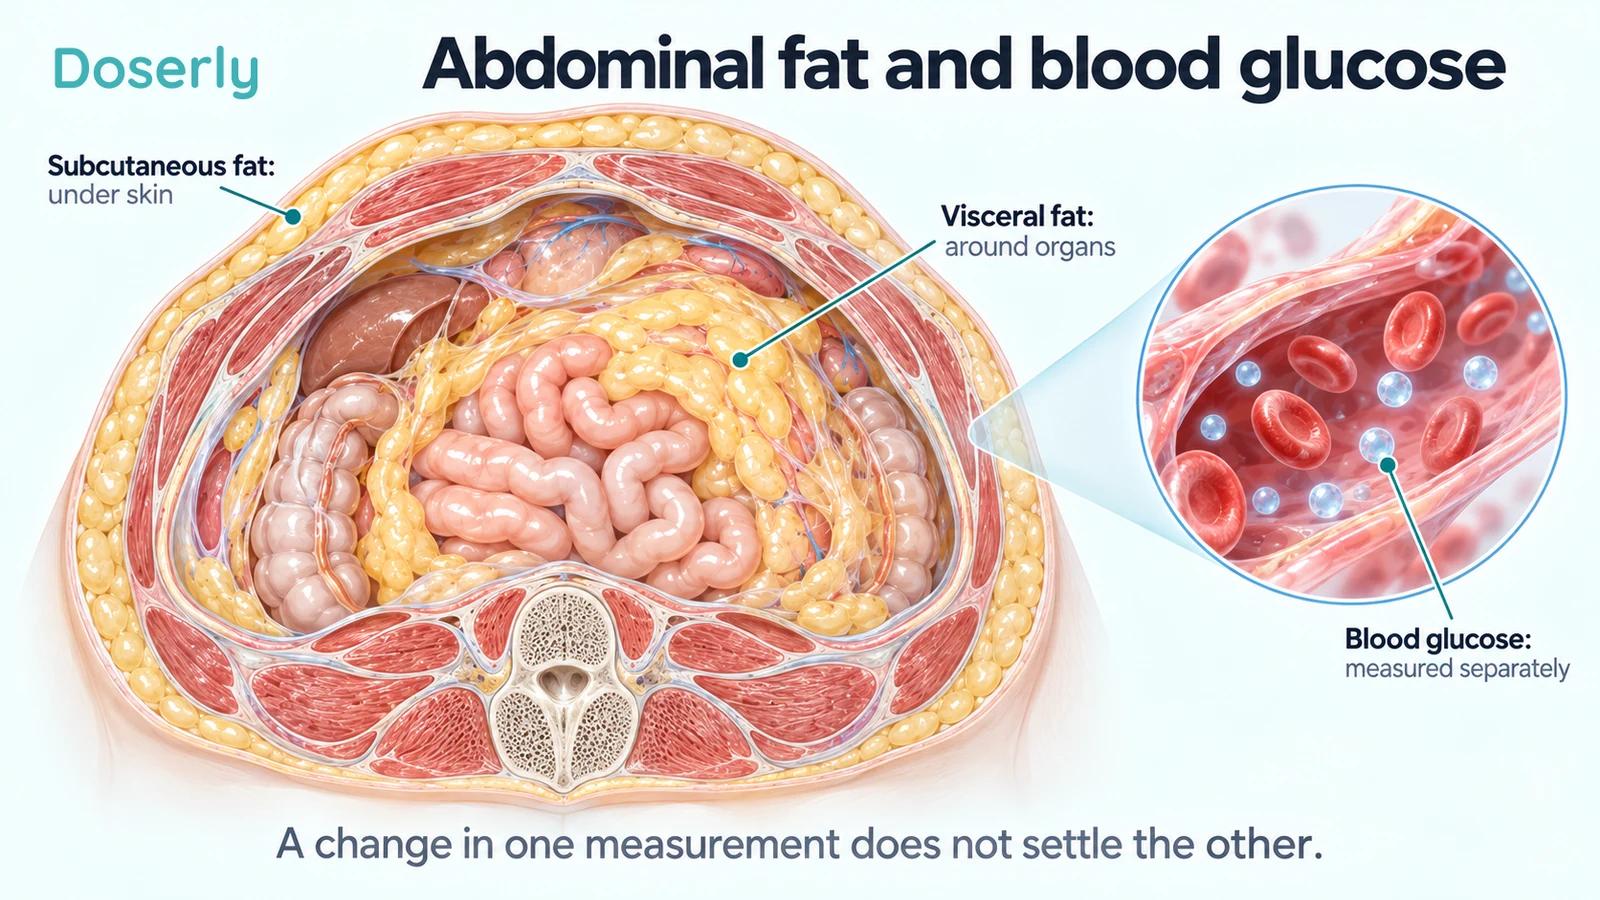
Visceral fat is fat inside the abdominal cavity, around internal organs. It differs from subcutaneous fat, the layer beneath the skin. A waist measurement includes several tissues, and body weight includes much more than fat. Researchers therefore use imaging when they want to measure a particular abdominal compartment.
In the pooled phase 3 tesamorelin analysis, 806 adults receiving antiretroviral therapy for HIV were randomized to tesamorelin or placebo. The main comparison lasted 26 weeks. The reported treatment effect on visceral fat was a 15.4% reduction relative to placebo, measured by computed tomography. The study also reported improvements in some lipid measurements and body-image outcomes. Those findings describe particular outcomes in adults with excess abdominal fat associated with HIV. Pooled phase 3 report
A smaller fat compartment is not a direct measurement of how the body handles glucose. Even when two measurements are related, they can respond differently to the same intervention. That is why it is useful to keep the scan result, laboratory results and symptoms alongside one another, rather than combine them into a single impression of “metabolic improvement.”
Why would a growth-hormone treatment affect glucose?
Tesamorelin stimulates the body's own growth-hormone release. Growth hormone has metabolic effects as well as effects related to growth, and the relationship with insulin action matters when researchers investigate treatment. Insulin helps regulate the movement and storage of glucose; impaired responsiveness to insulin is called insulin resistance.
The investigators who studied tesamorelin in people with type 2 diabetes explicitly designed their trial around the concern that growth-hormone exposure can impair insulin sensitivity. Their question was whether stimulating release with tesamorelin would alter insulin response or diabetes control. The biological reason for concern therefore existed before the trial results were known. Diabetes trial
This is a reason to measure glucose, not a reason to assume everyone will experience the same change. A person can have a favorable change in fat distribution while still needing a separate assessment of blood sugar. Likewise, a person whose average glucose stays stable has not necessarily gained every possible metabolic benefit.
Average glucose and new diabetes are different questions
The current US EGRIFTA WR label reports that HbA1c reached at least 6.5% in 5% of tesamorelin-treated participants versus 1% receiving placebo during the first 26 weeks. The label also reports an increased diabetes-risk estimate with uncertainty around it. It advises assessing glucose before treatment and monitoring during treatment. EGRIFTA WR is indicated for excess abdominal fat in adults with HIV and lipodystrophy, not general weight-loss management; long-term cardiovascular safety remains unestablished. Prescribing information, sections 1 and 5.4
Using the rounded proportions, the difference is approximately four percentage points: about five versus one in every hundred participants. That arithmetic is useful for scale, but it is not an individualized prediction. It also does not reproduce an adjusted statistical estimate, which may account for information beyond those two rounded percentages.
The pooled trial publication described no clinically meaningful differences in glucose parameters at weeks 26 and 52. This can sound inconsistent with the label's warning until you separate an average from a threshold event. Pooled analysis
Imagine a group in which most people's results change little while a smaller number develop substantially higher values. The overall average can remain modest even though the change matters greatly to those individuals. Conversely, a small shift in the average does not mean every participant developed diabetes. Both the continuous laboratory results and the number of clinically important events belong in the interpretation.
What do fasting glucose and HbA1c tell you?
A fasting glucose measurement describes blood sugar at one point under standardized fasting conditions. HbA1c, sometimes shortened to A1C, measures the proportion of hemoglobin with glucose attached and reflects average exposure over roughly three months. Hemoglobin is the oxygen-carrying protein inside red blood cells.
These tests need not move together immediately. A recent glucose change may not yet have its full effect on HbA1c. Conditions affecting red blood cells or hemoglobin can also complicate interpretation. When there are no clear symptoms, an abnormal diabetes-range result generally needs confirmation rather than a diagnosis based on a single unexpected value. NIDDK: A1C testing
For a patient, this makes the timing of laboratory work important. A result obtained before starting treatment and one obtained several months afterward provide different information from a single undated number. Record which test was performed, its units and whether it was a fasting sample. These details help a clinician interpret a trend without assuming that every result is interchangeable.
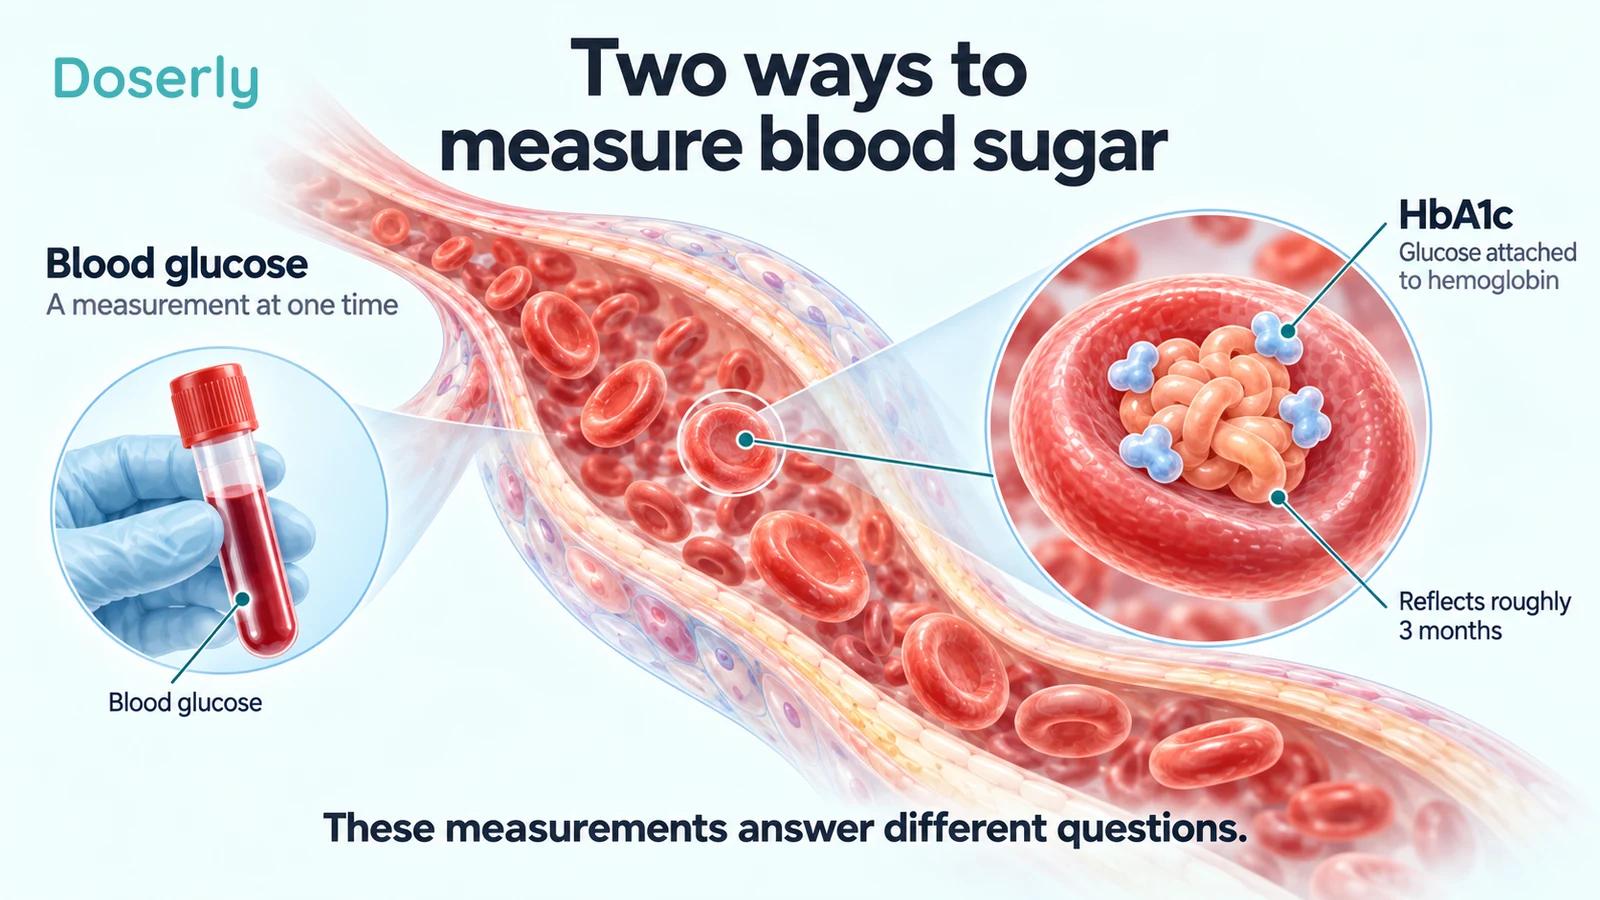
HbA1c reflects glucose exposure over roughly three months. Hemoglobin and attached glucose are enlarged conceptual shapes, not a molecular-scale representation. NIDDK
The early glucose rise in the six-month trial
A 2014 randomized trial assigned 50 adults with HIV and abdominal fat accumulation to tesamorelin or placebo; 48 received study treatment. It examined visceral and liver fat over six months.
At two weeks, fasting glucose rose by an average of 9 mg/dL with tesamorelin and 2 mg/dL with placebo. The estimated treatment difference was 7 mg/dL, with a 95% confidence interval of 1–14 mg/dL. At six months, the corresponding difference was 2 mg/dL, with an interval from −6 to 10 mg/dL; that later comparison did not establish a significant difference. Visceral and liver fat decreased with treatment. Stanley and colleagues, 2014
The timing matters. A reassuring later result does not erase an earlier change, and an early average increase does not prove permanent deterioration. The trial shows why “What happened to glucose?” needs a second question: “At what point?”
It also illustrates what a confidence interval adds. The six-month estimate was compatible with a range of differences in either direction. Describing it as proof of identical glucose effects would be stronger than the data support. The study was small and designed around fat measurements, not decades of diabetes complications.
What did the longer liver-fat study find?
A 2019 multicenter trial enrolled 61 people with HIV and fatty liver; 30 received tesamorelin and 30 placebo. The randomized comparison lasted 12 months. The main efficacy measurement was hepatic fat fraction, the proportion of liver tissue measured as fat by magnetic resonance spectroscopy, while glucose was the principal safety outcome.
Tesamorelin produced a greater liver-fat reduction, with an absolute treatment effect of 4.1 percentage points and a relative reduction of 37%. Changes in fasting glucose and HbA1c were not significantly different between groups at 12 months. Liver-fat trial
These are useful reassuring observations for the population and duration studied. They do not turn liver-fat reduction into a glucose treatment claim. The absolute and relative liver-fat figures also use different denominators: neither means that blood sugar decreased by 37%.
For someone with fatty liver, the result helps frame a targeted clinical discussion. It does not settle whether tesamorelin should be used for a different form of liver disease, whether it improves long-term clinical outcomes, or how a particular person's diabetes will behave. Those are additional questions rather than implied consequences of the imaging result.
Why the responder analysis is interesting but cannot predict your result
Researchers also examined 402 participants receiving tesamorelin in a per-protocol analysis of the phase 3 program. A visceral-fat reduction of at least 8% defined a responder. Responders had more favorable triglyceride changes and smaller increases in glucose-related measures than nonresponders. The metabolic comparisons were post hoc, although the response definition had been specified in advance. Responder analysis
That pattern is biologically interesting: the people whose visceral fat fell more also tended to have a better metabolic profile. But participants were not randomly assigned to become responders. The analysis groups people according to what happened after treatment began.
This distinction limits what the finding can promise. It does not establish that a certain amount of fat loss guarantees glucose safety, or that a waist change identifies someone who can stop laboratory monitoring. It also does not provide a reliable pre-treatment test for deciding who will benefit. A response association can guide further research and clinical assessment without serving as a guarantee.
Does the small diabetes trial remove the concern?
The 2017 diabetes study included 53 treated participants allocated to placebo or two tesamorelin doses for 12 weeks. Its overall analyses did not show a significant treatment effect on insulin response or glycemic control. No participant withdrew because of loss of diabetes control.
The full report contains an important detail beyond that broad summary: although the repeated-measures HbA1c analysis was negative overall, the week-12 change differed significantly between the higher-dose group and placebo. The reported mean changes were +0.1 and −0.5 percentage points, respectively. Full trial report
The study offers short-term information in a monitored diabetes population. With small groups, incomplete follow-up and only three months of treatment, it cannot settle long-term safety or cancel a warning drawn from a larger development program. Nor should one isolated comparison be expanded into a claim that the treatment universally worsens diabetes. The overall analysis and the specific difference should both remain visible.
How to make a treatment review useful
Start with the intended benefit. Is the goal a change in HIV-associated abdominal fat, a lower glucose value, improved appearance or reduced future cardiovascular risk? Those goals are different, and the evidence is stronger for some than others.
Bring a timeline of treatment changes, laboratory dates and any other changes that could affect interpretation. If a scan improves while glucose worsens, both deserve attention. A useful discussion considers how much benefit has actually occurred, how large and persistent the glucose change is, and what alternatives are available.
Ask the clinician to explain the monitoring plan in terms you can follow: which measurements will be used, when they will be repeated and what findings would lead to reassessment. There is no single scan result or appearance change that answers all three questions. Avoid changing diabetes medication or adding another peptide on the assumption that one treatment will automatically counterbalance another.
Tesamorelin's fat-reduction findings and its glucose warning belong in the same conversation. Understanding both lets you discuss the specific benefit being sought while taking your own laboratory results seriously. The tesamorelin guide's research section offers additional context for comparing the broader studies.
Sources
- EGRIFTA WR prescribing information: indication and glucose safety warning.
- Falutz and colleagues, 2010: pooled phase 3 trials.
- Stanley and colleagues, 2014: six-month visceral and liver-fat trial.
- Stanley and colleagues, 2019: 12-month HIV fatty-liver trial.
- Stanley and colleagues, 2012: responder analysis.
- Clemmons and colleagues, 2017: randomized diabetes trial.
- NIDDK: The A1C Test & Diabetes: measurement and interpretation.