
Red Light Therapy
October 17, 2026
Red light therapy dose: understanding irradiance, distance and treatment time
On this page
A red light device may advertise a wavelength, a power rating and a recommended session length. These numbers look reassuringly precise. Yet they describe different things, and none alone tells you how much light reaches the tissue you want to treat or whether that exposure improves a meaningful outcome.
This is where shopping for a light device can become unexpectedly confusing. One company emphasizes milliwatts per square centimeter. Another quotes joules. A research paper reports energy per treatment point. Someone online converts all three into a timer setting. The arithmetic may be correct while the comparison is wrong.
You do not need a physics degree to spot the problem. Start by separating the light leaving the device, the light arriving at the skin and the light absorbed within tissue. Then ask how the entire treatment was tested in people. Understanding that chain makes specifications more useful and helps explain why there is no universal red light dose for skin, hair, muscle, joints and the brain.
Power, irradiance and energy describe different parts of an exposure
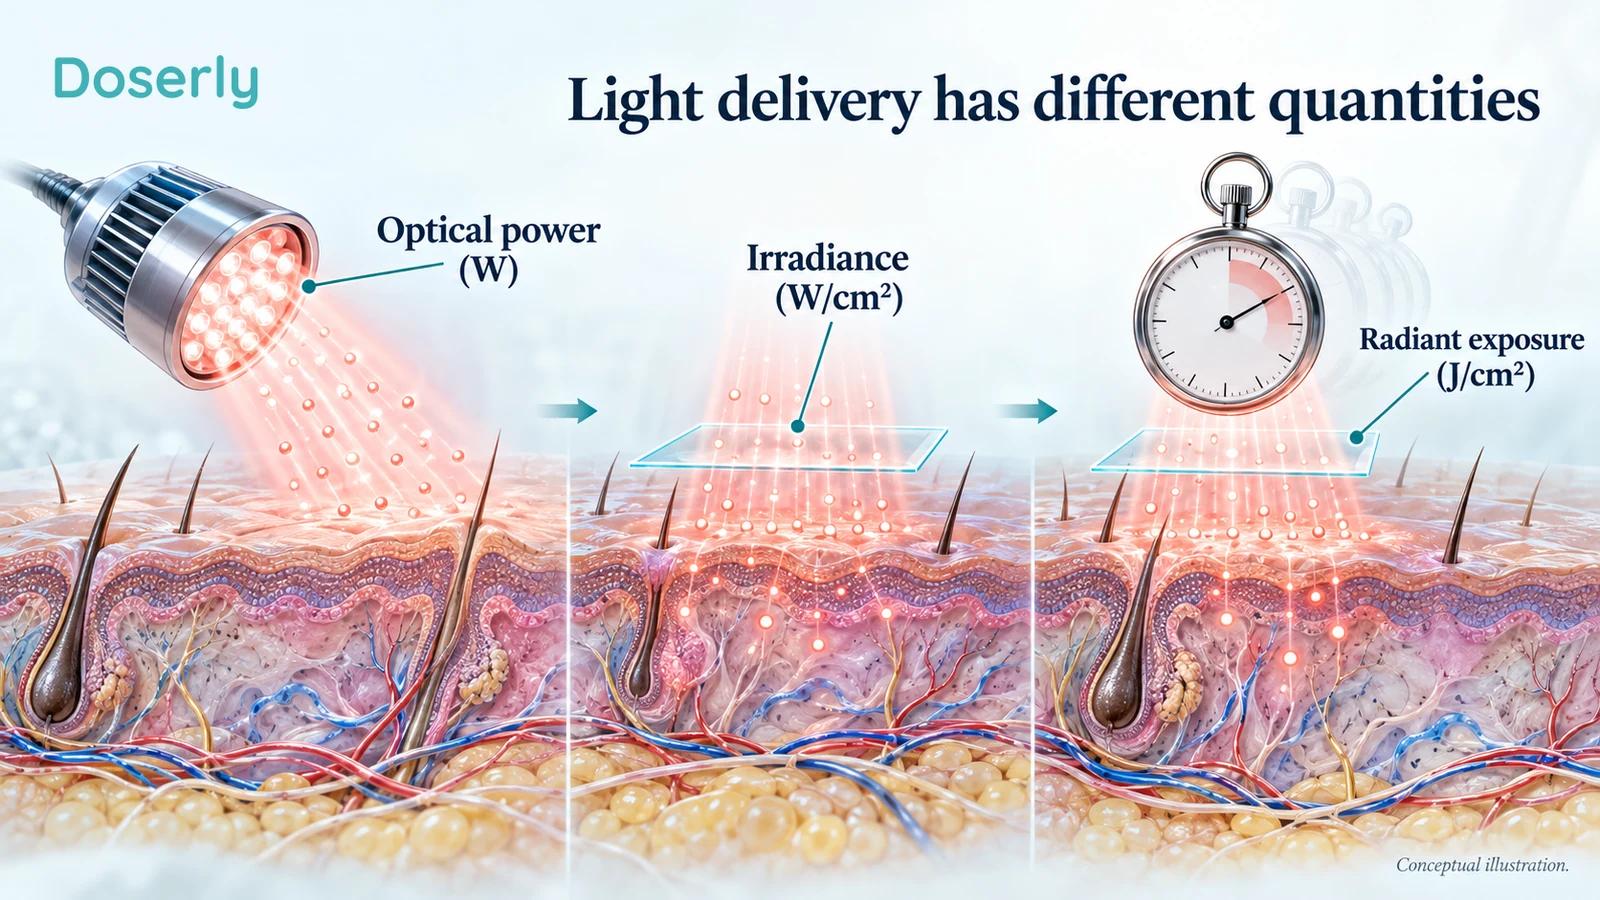
Power is a rate: how much energy is transferred per second. A watt is one joule per second. This relationship comes from the International System of Units, rather than from any particular light therapy theory.
A device's electrical power consumption is not its optical output. Some incoming electrical energy becomes heat or powers electronics. A label describing the electricity drawn from a wall outlet therefore cannot establish how much therapeutic light leaves the LEDs. Even an accurate measurement of total optical output does not tell you how that output is distributed over a face or leg.
Irradiance adds the area receiving the light. In this setting it is commonly expressed as milliwatts per square centimeter, written mW/cm². Think of it as the rate at which radiant energy arrives at a small patch of surface. A device can have substantial total output but spread it over a large area, producing a different irradiance from a small concentrated beam.
Radiant exposure describes the energy delivered per area over time. Its common unit is joules per square centimeter, J/cm². Papers and manufacturers often call this fluence or energy density. Those terms can become more technically complicated inside scattering tissue, so it helps to ask exactly where a reported measurement applies. Here, our arithmetic examples refer to incident radiant exposure at a surface.
Total energy, measured in joules without an area denominator, is another quantity again. Ten joules spread across one square centimeter and ten joules spread across a hundred square centimeters are not equivalent local exposures. You cannot compare a total-body energy number with a small treatment-point number without knowing the illuminated area and distribution.
A worked example that is only arithmetic
Imagine a hypothetical, continuously operating source delivering a measured average irradiance of 20 mW/cm² to a flat surface. Convert milliwatts to watts by dividing by 1,000. The irradiance is therefore 0.020 W/cm².
If that exposure lasts 300 seconds, multiplying 0.020 W/cm² by 300 seconds gives 6 J/cm². The seconds cancel because a watt already means a joule per second. Five minutes must become 300 seconds before using this version of the formula.
In compact form:
Surface radiant exposure (J/cm²) = average irradiance (W/cm²) × time (seconds).
These are deliberately invented numbers for understanding units, not a recommendation for any condition or device. The calculation assumes the stated irradiance actually reaches that surface, stays reasonably stable and represents the relevant area. It says nothing about how much energy a deeper target absorbs, whether the exposure is safe for a particular person or whether a trial supports its use.
A second hypothetical source could deliver the same 6 J/cm² by operating at 0.010 W/cm² for 600 seconds. That makes the two surface energy totals equal. It does not establish that their biological effects are equal. Rate, wavelength, tissue, temperature and treatment timing can still differ. The equation solves a bookkeeping problem; it does not settle a clinical one.
Why distance changes more than the timer
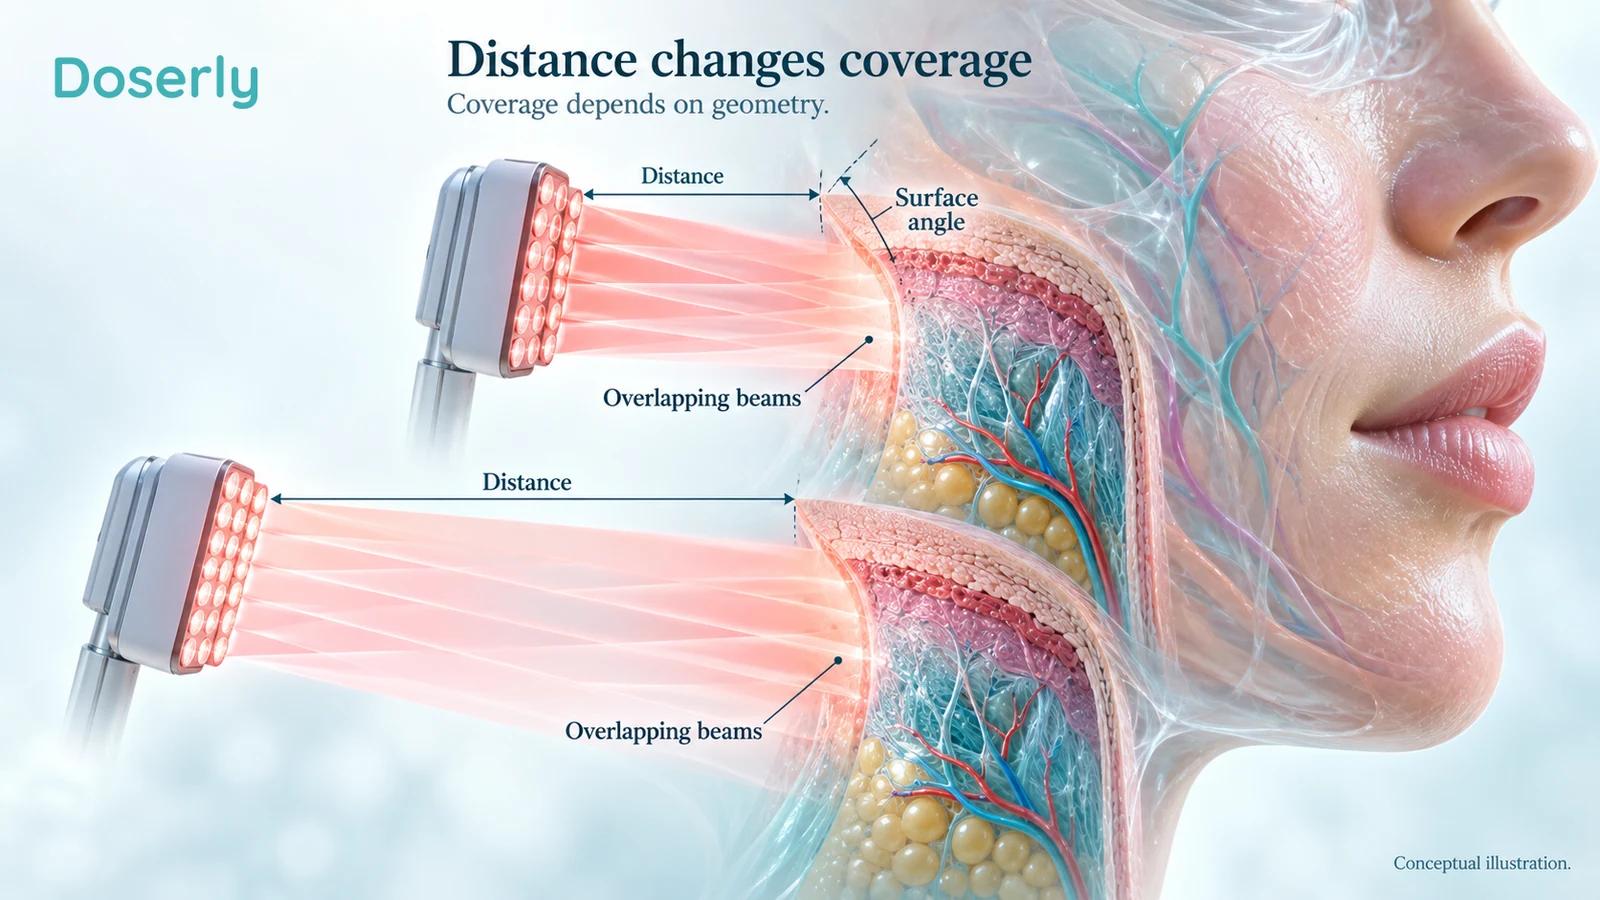
When you move away from a source, its light generally spreads differently across the target. The details depend on emitter arrangement, lenses, beam divergence and the size of the illuminated area. This is why a quoted irradiance needs a stated measurement distance.
The familiar inverse-square rule describes an idealized point source spreading freely into space. A nearby panel containing many emitters is not that idealized geometry. Treating every panel as a point source and calculating a new exposure from distance alone can give a false sense of accuracy. Actual measurements at the intended position are more informative.
A mask adds another complication. The forehead, cheeks, nose and jaw are not one flat plane. Their distances and angles relative to the emitters differ. A close-fitting device may improve repeatability, but the word close does not prove uniform illumination. Gaps, facial shape and how the mask sits all affect the geometry.
A 2025 pilot study of five home-use LED devices measured optical output and divergence and also examined heating in porcine tissue. The investigators found heterogeneous outputs and inconsistencies relevant to dosimetry. This was a small device study, not a human efficacy trial and not an audit of every current product. Its useful lesson is narrower: specifications and instructions need measurements that reflect how a device is actually used.
If a manufacturer supplies an irradiance measured at the emitter surface but recommends sitting farther away, those are different positions. If a study used direct skin contact while a home user holds a light several centimeters away, matching the wavelength and session length does not recreate the study exposure.
The practical question is therefore not simply, “How close should I sit?” It is, “At what position was this device measured and tested, and do its instructions describe that same position?” A treatment-specific answer requires the actual device documentation and clinical context.
A single strong reading can hide an uneven beam
Imagine measuring the center of a spotlight and then assuming every part of the illuminated floor receives the same brightness. The center reading may be accurate and still fail to describe the rest of the floor. Something similar happens when a device advertisement reports its strongest point as though it represents an entire treatment area.
A beam profile describes how output varies across space. A narrow beam may have a concentrated center and weaker edges. An array may produce overlapping regions with different intensities. A useful measurement therefore includes more than one conveniently bright location.
An independent 2022 study of 24 clinical laser devices found substantial differences between declared and measured power and beam dimensions. Actual power ranged from 2% to 134% of the declared value in this sample. The devices were approximately 11 years old on average, so these figures should not be used to accuse every new consumer panel of similar errors. They do show why maintenance, calibration and beam characterization matter even in clinical equipment.
An average also needs a clearly defined area. Averaging over the central treatment region may produce a different number from averaging over the entire illuminated footprint. Neither number is automatically fraudulent, but they answer different questions. A report should explain its measurement method rather than leave the reader to infer it.
This matters when a research protocol treats several small points. Multiplying the number of points by the energy at each point can describe total delivered energy. It does not prove that a broad panel delivering the same total energy exposes the same tissues in the same way. Spatial distribution is part of the intervention.
Pulsing makes peak and average output different
A continuous source stays on throughout an exposure. A pulsed source alternates between on and off periods. The power during an on period can be much higher than the average across the whole session.
Duty cycle describes the fraction of time the source is on. In a simplified rectangular pulse pattern, a source on for half the time has a 50% duty cycle. If its irradiance during each on period were 40 mW/cm² and truly zero between pulses, its time-averaged irradiance would be 20 mW/cm². This is another mathematical illustration, not a treatment setting.
Real devices may have more complicated waveforms. Pulse width, repetition rate, multiple wavelengths and output stabilization can complicate that calculation. Before multiplying irradiance by time, establish whether the reported value is peak, average or something else. Otherwise the result can be wrong even when the unit conversion is perfect.
A 2025 proposal for more standardized PBM reporting highlights distinctions including irradiance at the source aperture versus the target and details of pulsed operation. Such reporting work helps researchers describe an intervention reproducibly. It does not establish that a particular pulse frequency is best for every clinical purpose.
Frequency in hertz only tells you how often something repeats. It does not, by itself, reveal delivered energy or establish a special biological effect. If a product claims a particular frequency matches a brain rhythm or cellular process, that clinical claim still needs its own human evidence.
Surface exposure is not the dose at a deeper target
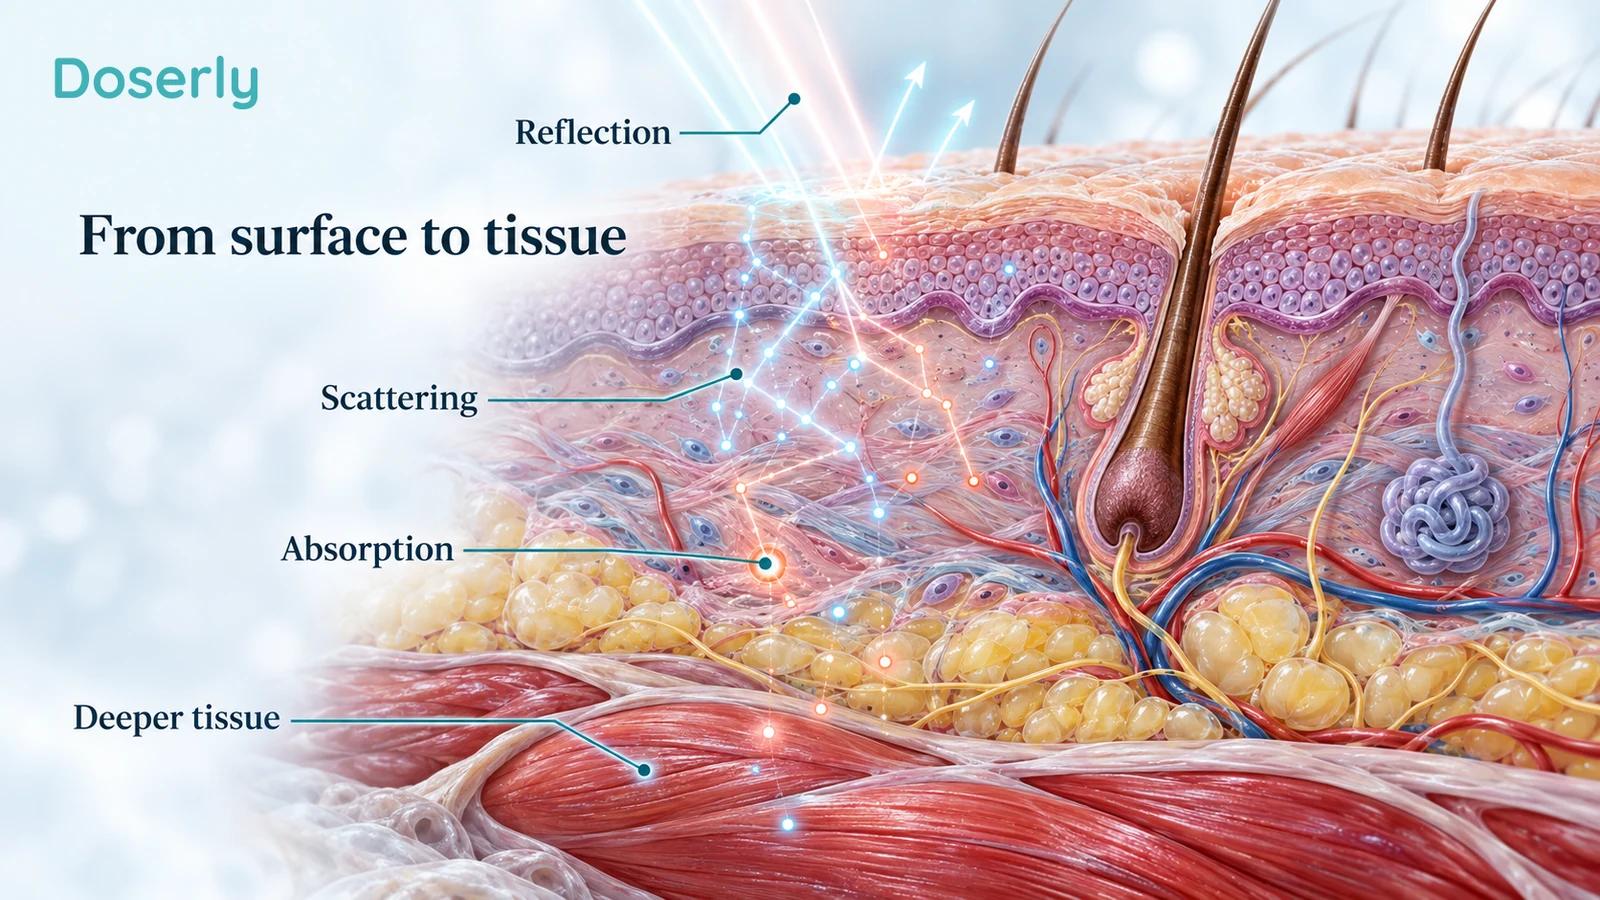
Light encounters several competing processes after it reaches skin. Some is reflected. Some is absorbed near the surface. Some is scattered, changing direction and extending its path through tissue. The remainder travels farther, with the balance depending on wavelength and tissue properties.
That means a number measured in the air where your skin would be cannot be relabeled as the dose to a tendon, muscle or brain. Even measuring light that exits the far side of a tissue sample does not directly measure the distribution absorbed by every structure inside it.
In an original 2019 study of 660 nm light transmission through human tissues, transmission depended on the tissue being examined and its characteristics. Findings from such experiments help explain why anatomy matters. They do not produce a universal conversion factor from a panel's surface irradiance to the exposure at any person's deeper target.
Hair, curvature, intervening tissue thickness and the location of the intended target can all change the problem. Optical models can estimate what happens under specified assumptions, but their outputs remain estimates. A model that predicts light arrival is not a clinical trial showing pain relief or tissue repair.
This also explains why a device tested on superficial facial skin cannot automatically claim an equivalent effect in a deep joint. The biological endpoint changes, the optical route changes and the relevant tissue may respond differently. More power at the surface does not resolve those uncertainties by itself.
What “more is not always better” actually means
Photobiomodulation is often described as having a biphasic dose response: an exposure may produce a different response when its intensity or duration changes, and increasing exposure need not keep increasing benefit. This is an important possibility, but it is often turned into a much stronger claim than the evidence supports.
The 2011 update on biphasic PBM responses discusses evidence from varied experimental systems, including laboratory and animal work. A curve observed in one cell experiment cannot identify the best home exposure for a human face. Nor does a stylized hill-shaped curve prove that every condition has the same optimal window.
There are several separate possibilities. A higher exposure might produce no additional effect. It might change the direction of a measured biological response. It might cause an adverse effect. Or the apparent difference might reflect measurement noise in a small study. Researchers must test these possibilities rather than assume the shape of the curve beforehand.
For a reader, the useful implication is modest: a device with greater maximum output is not automatically more effective. Neither is doubling a session because progress seems slow. A dose-response claim becomes clinically useful when investigators connect well-characterized exposures to outcomes that matter in the relevant population.
That connection is especially important when a marketing explanation stops at mitochondria. Cellular energy pathways are an active research topic, but a proposed mechanism does not supply a treatment schedule. Our SS-31 evidence guide considers a different intervention involving mitochondrial biology; sharing a biological theme does not make its evidence interchangeable with light therapy or justify combining the two.
Human dose studies sometimes find no performance benefit
A useful dose study compares multiple exposures against a suitable control instead of simply observing people before and after treatment. The result need not identify a winning dose.
In a 2024 randomized crossover trial, 18 recreational runners received placebo or one of three total-energy exposures before a 5 km running test. The tested exposures were 300, 900 and 1,260 joules, delivered with a specific red and infrared LED arrangement over leg muscles. Running time, mean speed and perceived exertion did not differ meaningfully between conditions.
Those numbers are descriptions of the study, not a menu for self-experimentation. The trial does not show that all possible PBM approaches fail for every athletic outcome. It does show that increasing the total energy across these tested conditions did not deliver the anticipated improvement. A dosing discussion that includes only positive experiments would miss that important result.
A clinical question should therefore come before dose optimization. If a particular outcome has not been shown to improve reliably, searching for a more precise timer setting may not solve the underlying uncertainty. Sometimes the honest answer is that the intervention remains unproven for the proposed goal.
A biological signal can change without symptoms improving
A recent 2026 randomized study in 31 people with major depressive disorder examined acute brain imaging responses to different transcranial PBM exposures. It found differing changes in blood-oxygenation-level-dependent signal power across conditions. The single administrations did not significantly improve depression severity compared with sham.
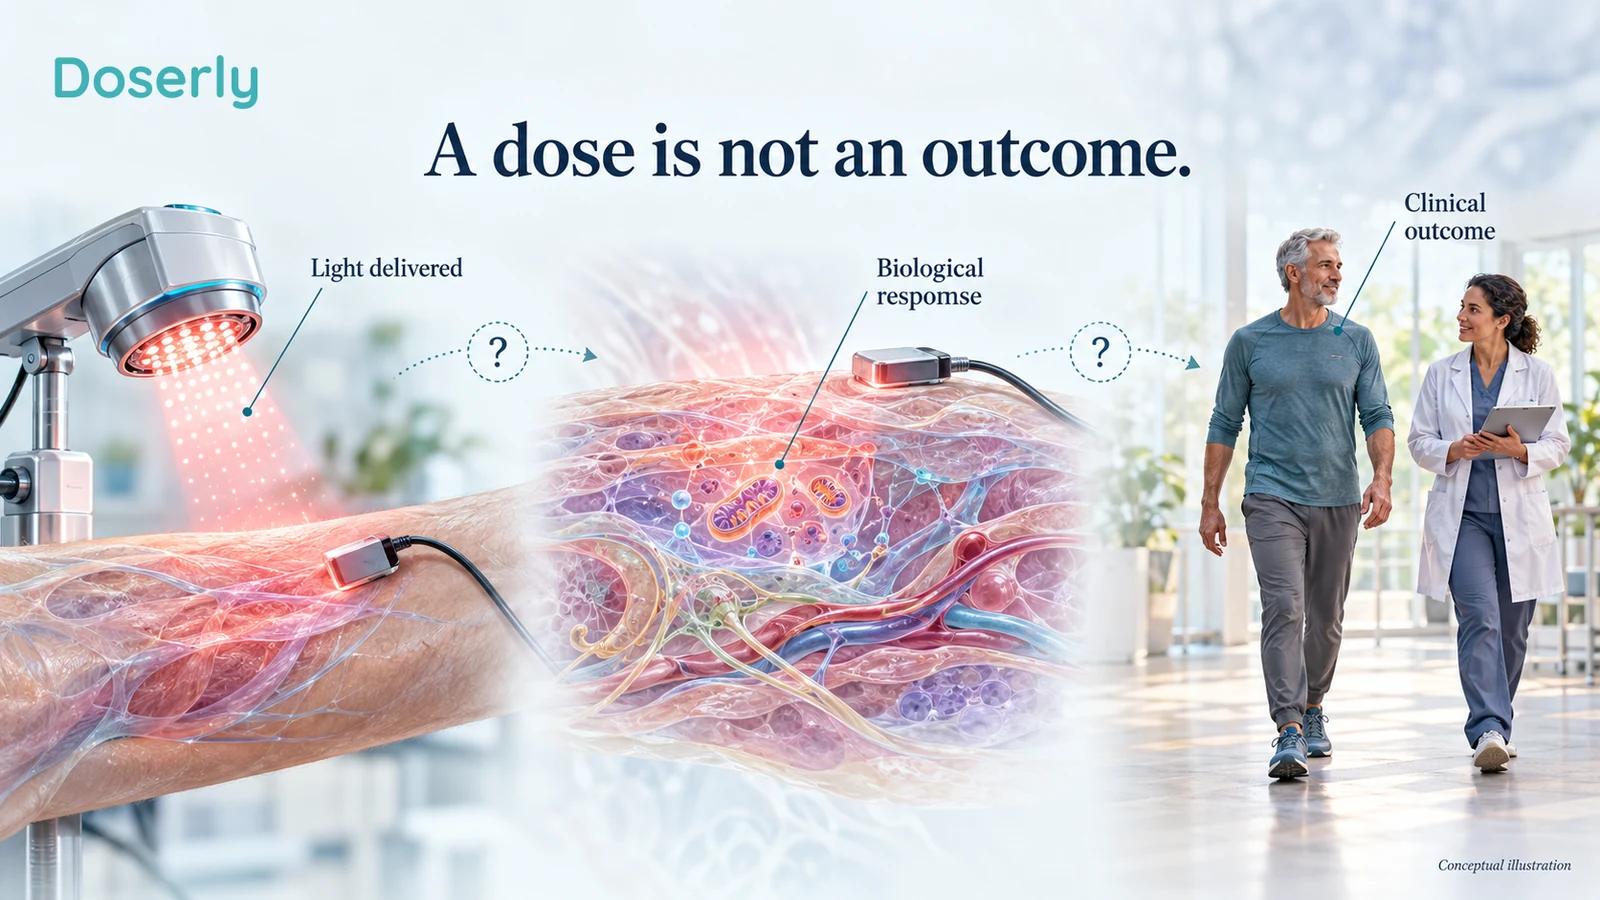
This is a valuable distinction. A physiological measurement can help researchers investigate dose selection while leaving the clinical treatment question unanswered. The study also reported relevant commercial relationships, including device-company employment and intellectual-property interests. These disclosures do not erase the findings, but they belong alongside the small sample and acute design when judging what the results establish.
Brain imaging outcomes are not instructions to use a consumer panel on the head. The equipment, delivery conditions, assessment methods and clinical oversight in a research study are part of the intervention. A difference in a scan is not a validated substitute for feeling or functioning better over time.
Safety limits and effective doses are different questions
A dose that does not cause a serious adverse event in a study is not necessarily effective. Conversely, a low-power label does not make every exposure harmless. Duration, location, device design, skin response and individual circumstances still matter.
Two randomized red LED safety trials published in 2020 studied escalating exposures on forearm skin. The investigators observed dose-limiting effects at high exposures, including blistering or prolonged redness, with different findings across the studied skin-type groups. These were controlled safety experiments, not home-use recommendations or a universal safe maximum for every body site.
Their practical contribution is to challenge the idea that visible red light can be increased indefinitely without consequence. They do not establish an ideal anti-aging dose, and their numerical limits should not be transferred to a different device, body region or exposure pattern.
Comfort is also an imperfect measuring instrument. Warmth does not quantify a useful PBM dose, and lack of warmth does not establish appropriate eye exposure. Device-specific instructions and relevant clinical advice remain necessary when the intended application involves sensitive structures, a medical condition or a history of unusual light reactions.
If a device causes persistent redness, pain or unexpected pigment changes, extending the exposure to “push through” is not a sensible interpretation of dose optimization. The response calls for stopping and assessing what happened, rather than treating irritation as proof of cellular activation.
What a useful specification sheet should let you understand
A longstanding reporting paper by Jenkins and Carroll identified the information needed to describe photomedicine interventions reproducibly. Wavelength and power are only part of that description; treatment area, time, pulse details, location and session scheduling also matter.
When reading a device study or specification sheet, look for a coherent account of the actual exposure:
- The wavelength or wavelengths and whether they operate together.
- Optical output and irradiance, with the measurement position clearly stated.
- The treatment area and how uniformly it receives light.
- Whether output is continuous or pulsed, and whether figures are peak or average.
- The device placement, exposure duration and number of sessions used in the trial.
- The population, comparator and clinical outcome that were actually tested.
These details should fit together. A study reporting a small contact probe cannot validate a broad noncontact panel merely because both use red light. Likewise, an impressive laboratory power measurement does not replace a clinical comparison.
Avoid using a phone camera, visual brightness or a household lux reading as a substitute for calibrated optical characterization. NIST's explanation of photometric units distinguishes measurements weighted to human vision from radiant quantities. Near-infrared light adds an obvious problem: much of the relevant output is not visible to the eye at all.
The most useful dosing information is therefore not the largest number on the product page. It is a transparent connection between a measured device, a repeatable application and a credible human outcome. Once that connection is clear, units and timers become helpful tools. Without it, extra decimal places can make an uncertain treatment look more settled than it is.