
Peptides
October 16, 2026
Does pemvidutide preserve muscle? Reading the MRI substudy
On this page
Pemvidutide's body-composition findings are encouraging, but the phrase “preserves muscle” gives them more certainty than the available measurements support. An MRI substudy found that most of the weight lost by participants receiving pemvidutide was attributable to fat. It did not establish that no muscle was lost, that strength improved, or that the medicine prevents frailty.
Those are different questions. Someone considering weight-management research may care about all of them: less abdominal fat, enough muscle to remain active, and the ability to climb stairs or carry groceries. A scan can help with the first two, but the third needs its own assessment. Understanding what the substudy actually measured makes the result more useful, without turning a promising observation into a guarantee.
The Doserly pemvidutide guide covers the wider development program. Here, the focus is the specific muscle-preservation claim and the evidence that would make it more convincing.
What happened in MOMENTUM
MOMENTUM enrolled 391 adults with obesity, or overweight plus a related condition, without diabetes. Participants received placebo or one of three pemvidutide doses for 48 weeks, alongside diet and exercise. The sponsor's June 2024 report described average weight reductions of 10.3%, 11.2% and 15.6% in the active groups, compared with 2.2% with placebo. Those are whole-trial weight results, not the sample size or outcome of a dedicated muscle trial. MOMENTUM ADA report
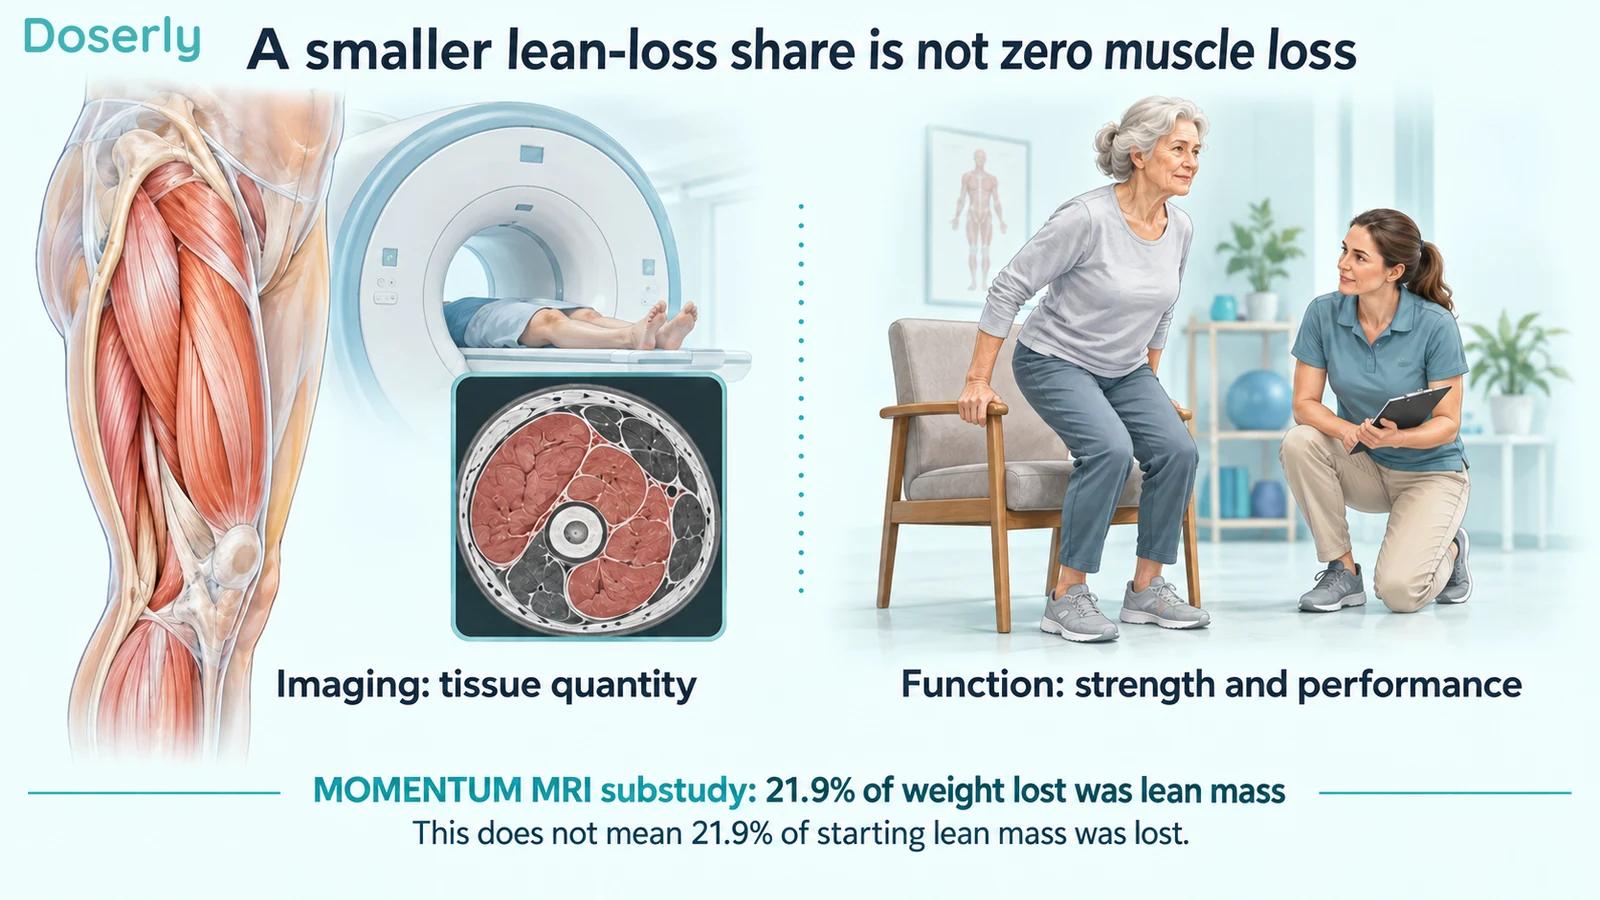
The MRI analysis involved 67 participants, including 50 treated with pemvidutide. In the treated participants, the reported lean-loss ratio was 21.9%. The sponsor also reported 19.9% in participants aged 60 or older. These figures came from a small subset and were publicized through conference-related company releases; they should be identified that way when quoted. Corrected EASD report
The distinction between the main trial and its imaging subset matters. Randomization of several hundred people does not automatically give a smaller analysis the same precision or representativeness. To judge the latter, readers need the numbers with paired scans, reasons scans were unavailable, baseline characteristics, and results by assigned group. A pooled active-treatment percentage alone does not provide all that information.
What 21.9% actually means
The reported ratio describes the composition of the weight that disappeared. It does not describe the percentage of someone's starting muscle that disappeared.
Consider an invented example, using rounded numbers purely to explain the arithmetic. If someone lost 10 kilograms, and 2.2 kilograms of that change were classified as lean mass, lean tissue would account for 22% of the weight loss. That person would not have lost 22% of their original lean mass. If starting lean mass were 60 kilograms, the 2.2-kilogram change would be about 3.7% of that starting amount.
The two percentages answer different questions:
- Share of weight loss: how much of the total change came from lean tissue?
- Change from baseline: how much of the original lean tissue was lost?
A smaller share can be desirable, but the absolute change still matters. Someone losing 20 kilograms with a 20% lean-loss share would lose 4 kilograms of lean tissue. Someone losing 10 kilograms with a 30% share would lose 3 kilograms. The first ratio looks better while the absolute lean loss is larger. Neither example describes an actual MOMENTUM participant or compares real treatments.
This is also why a percentage cannot be interpreted without knowing total weight loss. If the denominator is small, modest measurement variation can move the ratio considerably. Reporting starting and final tissue amounts, absolute changes, uncertainty and the ratio together gives a clearer account than highlighting the ratio alone.
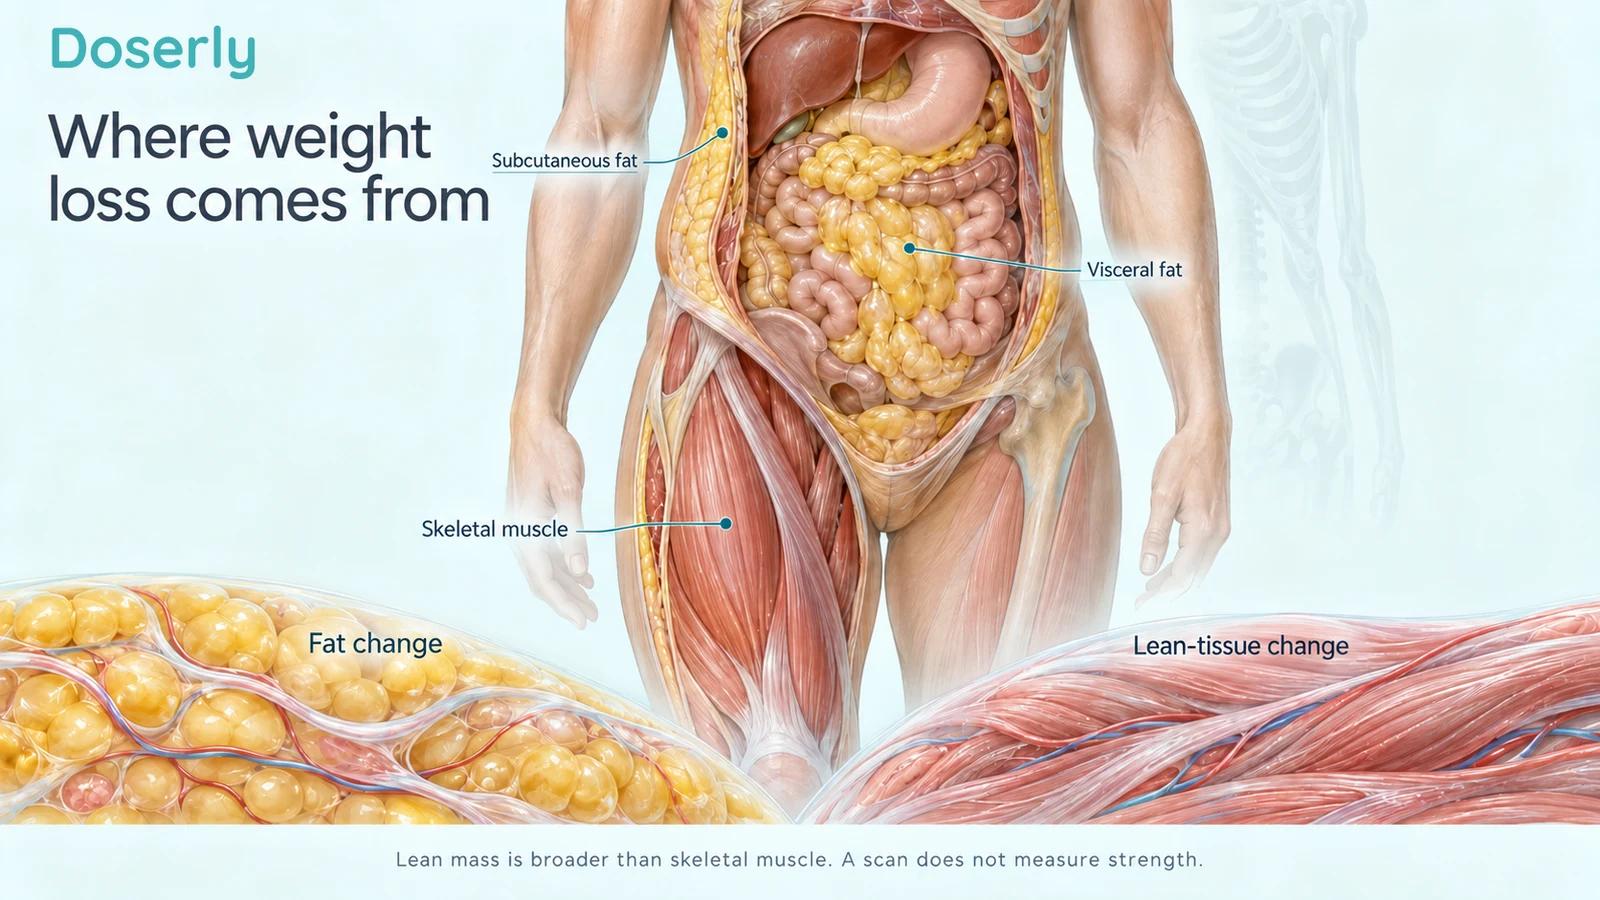
Lean mass is broader than skeletal muscle
“Lean mass” sounds like a synonym for muscle, but body-composition terminology depends on the measurement. DXA separates bone mineral, fat and lean soft tissue. The lean-soft-tissue compartment contains more than skeletal muscle, and technical conditions influence repeat measurements. The International Society for Clinical Densitometry emphasizes standardized preparation and positioning when following body-composition changes. ISCD official positions
MRI can identify anatomical compartments differently, including fat within the abdomen and muscle volumes in selected regions. That makes it valuable, but it does not make every MRI-derived lean estimate interchangeable with every DXA result. A report should name the method and anatomical coverage rather than treating “body composition” as one universal test.
For example, a thigh-muscle measurement addresses a particular region. A whole-body lean estimate addresses a broader compartment. Neither should silently replace the other in a headline. If a future report specifically measures skeletal muscle, that would strengthen a muscle-specific interpretation; if it measures lean tissue more broadly, the wording should remain broad.
The same caution applies to casual comparisons with home scales. An estimate from a consumer device is not a repeat of a research MRI protocol. A change in the app's muscle number may be useful to discuss, but it cannot confirm that an individual is reproducing the drug's substudy result.
Muscle quantity and physical ability need separate evidence
The reason people care about preserving muscle is usually practical. They want to stay mobile, remain independent, recover from illness, and participate in activities they enjoy. These goals need measurements of performance as well as tissue.
NIH-supported sarcopenia research has examined grip strength and appendicular lean mass as distinct characteristics when developing diagnostic criteria. The separation reflects an important clinical idea: muscle amount and weakness are related but different observations. NIA research summary
For a drug trial, an informative assessment might include measured strength, walking performance and patient-reported ability alongside imaging. A stronger inference would show that a favorable tissue change was accompanied by maintained or improved function, with a suitable comparison group. Falls and fractures are another step further: proving a reduction would require those events to be collected and studied adequately.
The older-adult subgroup is therefore interesting, but it is not a frailty-prevention trial. Age 60 or older is not the same as having diagnosed sarcopenia, impaired mobility or a history of falls. A favorable percentage in a small age subgroup cannot tell us how treatment would affect an older person with substantial functional limitations.
The corrected fat-compartment findings add context
A September 2024 correction changed two figures in the sponsor's EASD release. At the highest studied dose, the corrected reductions were 28.3% for visceral adipose tissue and 19.5% for subcutaneous adipose tissue. These describe different fat compartments; neither is a muscle-loss percentage. Corrected EASD report
Visceral fat sits within the abdominal cavity, while subcutaneous fat lies beneath the skin. Distinguishing them gives a more detailed picture than body weight alone. It also prevents a misleading shortcut: a greater reduction in one fat compartment cannot establish that a medicine is directly building muscle.
The correction itself offers a useful reading habit. Prefer the corrected report, preserve the measurement labels and avoid circulating screenshots with superseded numbers. A correction does not automatically invalidate a study. It does mean that the exact version matters, particularly when a chart is detached from its original explanation.
Why “best muscle preservation” remains unproven
The sponsor described the findings as favorable compared with historical reports. That is a hypothesis-generating comparison, not the same experiment as randomly assigning people to pemvidutide and another medicine and measuring them identically. MOMENTUM ADA report
Differences in age, starting body composition, total weight loss, diabetes status, follow-up, dietary support and imaging method can change the apparent lean-loss share. The treatment groups may also have different rates of discontinuation or missing scans. Combining these differences into a ranked list gives an impression of precision that the studies were not designed to supply.
A useful direct comparison would prespecify the body-composition outcome, use the same measurement protocol, and report both absolute tissue changes and function. It would show what happened to all randomized participants as clearly as possible, including those who stopped treatment. It would also explain whether the analysis addresses the drug's effect under continued use or the overall experience after assignment to treatment.
Until then, “a promising body-composition signal” is a more defensible description than “proven muscle-sparing superiority.” This is not a semantic objection: the stronger claim could lead someone to disregard changes in strength or nutrition because they believe a drug protects them automatically.
What the pooled figure leaves unanswered
The 21.9% figure pools treated participants from an MRI subset. It should not be attached to the largest whole-trial weight-loss percentage as though both numbers describe exactly the same people at one dose. The main-trial result and the imaging analysis have different denominators and serve different purposes. MOMENTUM ADA report
There is another mathematical detail worth checking in a full analysis: the average of individual lean-loss ratios is not necessarily the ratio calculated from the group's average tissue losses. Imagine two invented participants. One loses 2 kilograms, including 1 kilogram of lean tissue; the other loses 10 kilograms, including 2 kilograms of lean tissue. Their individual ratios are 50% and 20%, averaging 35%. Pooling the changes gives 3 kilograms of lean loss out of 12 kilograms total, or 25%. Neither calculation is inherently dishonest, but they summarize the participants differently.
That example does not identify which calculation generated the sponsor's result. It shows why the analysis definition matters before using a pooled percentage in a comparison. A full report should explain the calculation, treatment groups, uncertainty and handling of participants whose weight changed very little or increased. Without those details, a precisely printed decimal can look more individualized than the underlying evidence allows.
For an individual, preserving the capacity to perform a valued activity may be more informative than trying to reproduce a pooled ratio. Recording that goal before treatment also makes later changes easier to discuss without judging success solely by a scan.
What this means for a real weight-management discussion
For someone already receiving weight-management care, a useful conversation includes what is happening beyond the scale: appetite, ability to eat adequately, fatigue, activity and meaningful changes in strength. The appropriate assessment depends on the person. A research percentage is not a target that everyone should try to reproduce.
Exercise evidence illustrates why body composition should be interpreted alongside function. In a randomized study of 160 older adults with obesity, weight management plus combined aerobic and resistance exercise improved physical performance; resistance-containing programs also limited lean-mass loss compared with aerobic exercise alone. Participants could improve strength while still losing some lean mass. This was an exercise study, not a pemvidutide study, and it does not prove a specific program will offset any drug's effects. Original randomized trial
It does show why “some lean tissue was lost” and “physical ability worsened” are not interchangeable statements. A treatment discussion should make room for both measurements instead of assuming that one perfectly predicts the other.
The practical questions are therefore concrete: how much weight changed, which tissue compartment changed, how reliable was that measurement, and how is the person functioning? Pemvidutide's MRI findings contribute to the tissue question. Larger, transparent studies with functional outcomes are needed to complete the answer about preserving muscle health.
Explore the research
- MOMENTUM ADA report, June 2024 — sponsor report of the trial and imaging analysis.
- Corrected EASD report, September 2024 — corrected fat-compartment data and subset size.
- ISCD official adult positions — body-composition measurement standards.
- NIA sarcopenia research summary — muscle quantity and strength as separate assessments.
- Villareal and colleagues, 2017 — randomized exercise and weight-management trial in older adults.