
Peptides
October 16, 2026
Does a retatrutide weight-loss curve predict your result?
On this page
A weight-loss curve can make a treatment's future look unusually clear: start here, follow the line, arrive at a particular percentage several months later. Retatrutide's clinical-trial curves have drawn attention because the average reductions were substantial. But the line describes a study group. It isn't a schedule each participant followed, and it cannot tell you exactly what you would weigh at a future visit.
Retatrutide acts at the receptors for three hormones involved in metabolism: GLP-1, GIP and glucagon. Researchers have tested whether this combined activity improves weight and metabolic outcomes. To understand those findings, it helps to separate three questions: how the average changed, how responses differed between people, and how the analysis handled incomplete treatment or measurements.
We'll use the published 2023 phase 2 obesity trial as a worked example. It is a specific historical trial, not a claim that it is the newest retatrutide study. Its clearly reported results provide a useful way to understand the curves you encounter in research articles and online discussions. For the broader compound background, see our retatrutide guide.
What the phase 2 trial measured
Researchers randomized 338 adults to different weekly retatrutide regimens or placebo for 48 weeks. The primary endpoint was percentage weight change at week 24; week 48 weight change and the proportions reaching specified weight-loss thresholds were secondary endpoints. The trial therefore asked more than one question about weight. Primary trial abstract.
The registered study record adds context: participants were adults aged 18–75, diabetes was excluded, and there were restrictions concerning recent weight changes, other weight-affecting medicines and several health conditions. Participants also agreed to study procedures and lifestyle advice. A result from this population does not become a forecast for everyone who sees the graph.
These details matter when comparing your circumstances with a study. Someone already using another weight-management medicine, someone with diabetes and someone starting treatment after a major illness are not necessarily facing the same question. The graph alone does not show all the eligibility decisions that shaped the group behind it.
An average reduction is not a weekly target
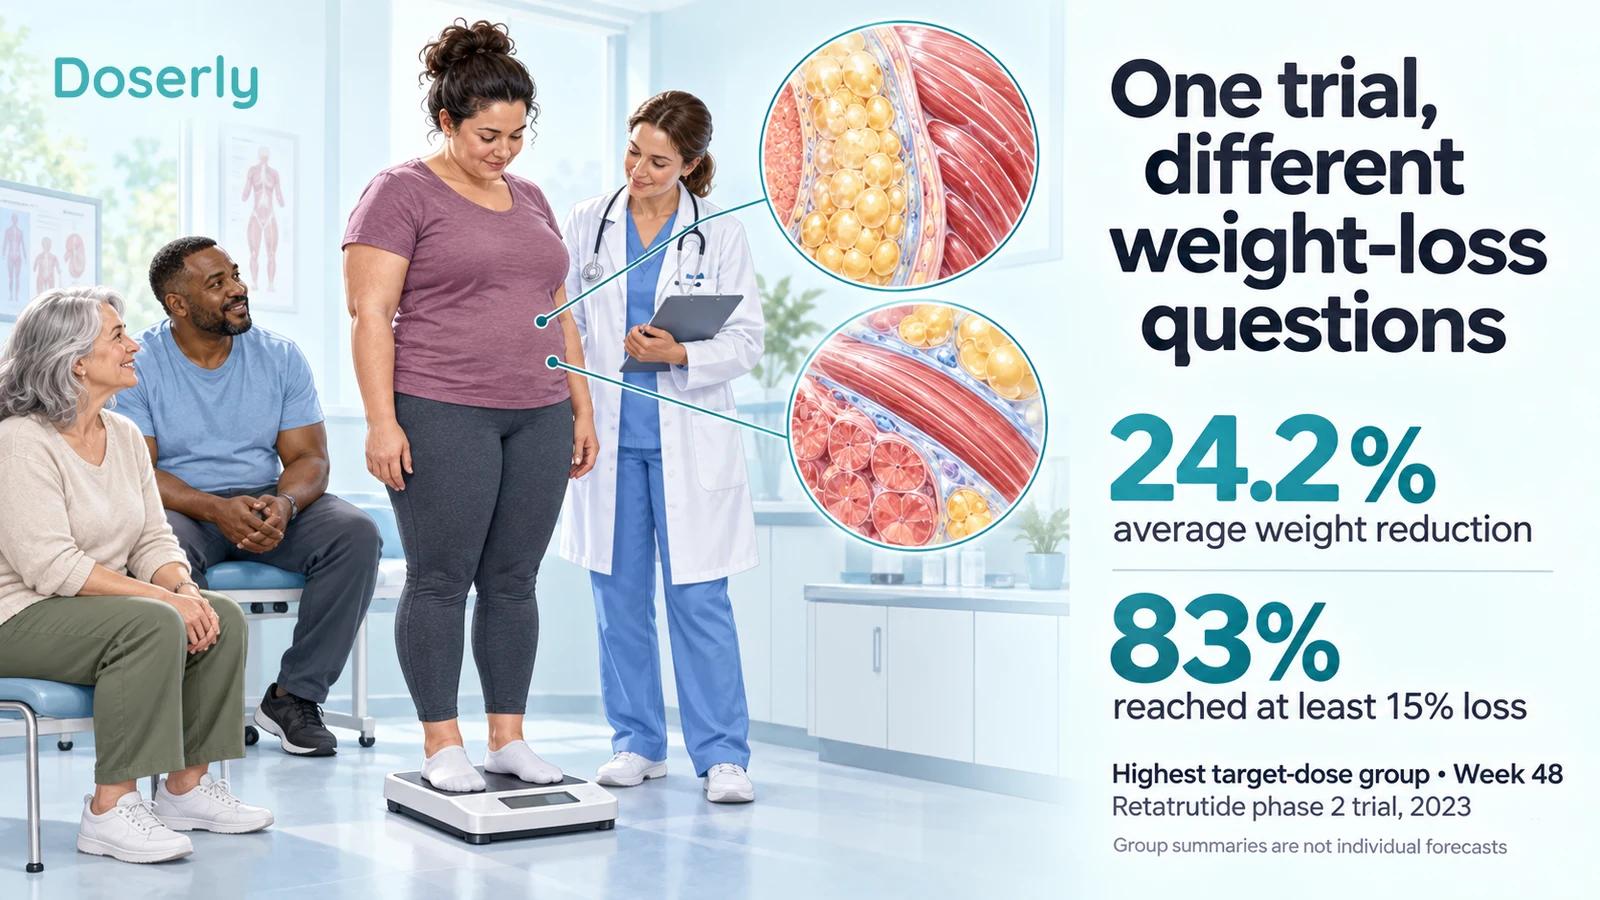
At week 48, the published estimated mean reductions were 8.7%, 17.1%, 22.8% and 24.2% across the four target-dose levels, compared with 2.1% for placebo. The higher target-dose groups were not a sequence through which every participant progressed; they were randomized treatment groups. Phase 2 results.
It is tempting to divide a final percentage by 48 and treat the answer as an expected weekly pace. Mathematically, that gives an average rate over the whole interval. It does not reconstruct what happened each week. A journey that loses more weight early and slows later can have the same endpoint as one that begins slowly and accelerates.
Percentage change also depends on the starting weight. In a purely illustrative calculation, a 10% reduction from 100 kg is 10 kg, whereas a 10% reduction from 80 kg is 8 kg. Neither example describes a trial participant. It shows why matching somebody else's kilogram loss is different from matching their percentage loss.
A percentage is useful for comparing people who begin at different weights, but it does not make their physiology or clinical needs identical. The meaningful question is whether the change improves health and remains tolerable, rather than whether an individual's weekly measurements stay close to a published line.
The line does not show the full range of responses
Two groups can have the same mean and very different experiences. Imagine five hypothetical changes of 10%, 10%, 10%, 10% and 10%. Now imagine 2%, 6%, 10%, 14% and 18%. Both groups average 10%; the second has much greater variation. These invented numbers explain arithmetic, not retatrutide outcomes.
Trials partly address this limitation by reporting responder thresholds: the proportion reaching at least a specified change. In the highest target-dose phase 2 group, the published week 48 estimates included 93% reaching at least 10% reduction and 83% reaching at least 15%. Those percentages answer a different question from the group's 24.2% mean. Published threshold results.
They also overlap. Someone who loses 20% belongs in the “at least 10%” and “at least 15%” categories. Adding those percentages would count people more than once. And a threshold does not reveal exactly how far above or below it each person finished.
For a reader, this means a headline average is only the beginning. Look for the distribution or threshold results alongside it. Even then, a group-level probability under study conditions is not a validated personalized prediction based on your health history.
What does a confidence interval tell you?
A confidence interval describes statistical uncertainty around an estimated result. It is not usually the interval containing 95% of individual patients' weight changes. This distinction matters because a trial can estimate its group mean relatively precisely while individuals still respond very differently.
Think of two questions: “How uncertain is our estimate of the average?” and “How much do people vary around that average?” These require different information. A narrow confidence interval around a mean can coexist with a broad spread of individual responses. Larger studies often sharpen the first answer without eliminating the second.
Statistical guidance emphasizes choosing the treatment effect of interest and an analysis appropriate to it. Before using a number, you need to know which effect it estimates and which sources of uncertainty the calculation addresses. ICH E9 statistical principles.
This is why a graph's thin shaded band should not automatically become a personal target range. Check the figure legend: the band may represent confidence intervals, standard errors or something else. Those alternatives have different meanings.
What happens to people who stop treatment?
Over a long trial, some participants stop the assigned medicine, miss measurements or start another intervention. These events are clinically meaningful and statistically important. An estimand is the precisely defined treatment effect the researchers want to estimate, including how such events fit into the question.
One approach asks about assignment to a treatment strategy regardless of later discontinuation. Another asks a hypothetical question about what would happen under continued treatment without a specified additional intervention. Neither definition makes missing observations disappear. Analysts still need methods and assumptions to address data they do not have. ICH E9(R1) estimand guidance.
For example, a person who stops because of nausea might still return for weight measurements. Their treatment stopped, but their follow-up did not. Another person might continue treatment yet miss the final measurement. “Stopped treatment” and “missing outcome” describe different situations.
When a report uses terms such as “efficacy” or “treatment regimen,” read its actual definitions. Do not assume that every sponsor uses a label identically. A higher number under a continued-treatment question should not be described as the guaranteed outcome for anyone who simply persists.
Why curves slow down without explaining the reason
Body-weight change is dynamic. As weight and food intake change, energy expenditure and appetite can change too. Research underlying the NIDDK Body Weight Planner models those relationships over time instead of assuming that a fixed calorie difference creates a fixed weekly weight loss forever. NIDDK research explanation.
That helps explain why a straight-line projection is biologically simplistic. It does not, however, diagnose the reason for one person's plateau. A trial curve cannot determine whether a specific person's recent change reflects adaptation, treatment exposure, measurement variation or another health issue.
A curve still declining at the last study visit also does not tell us how far it would fall if extended. Drawing the same slope into the future assumes a pattern the trial has not observed. A later study can supply more follow-up, but it should be read on its own design and population.
The useful response to a plateau is to review the clinical situation and the time pattern. It is not to infer a required dose change from how far a personal line sits above a trial average.
Total weight is not the same as fat loss
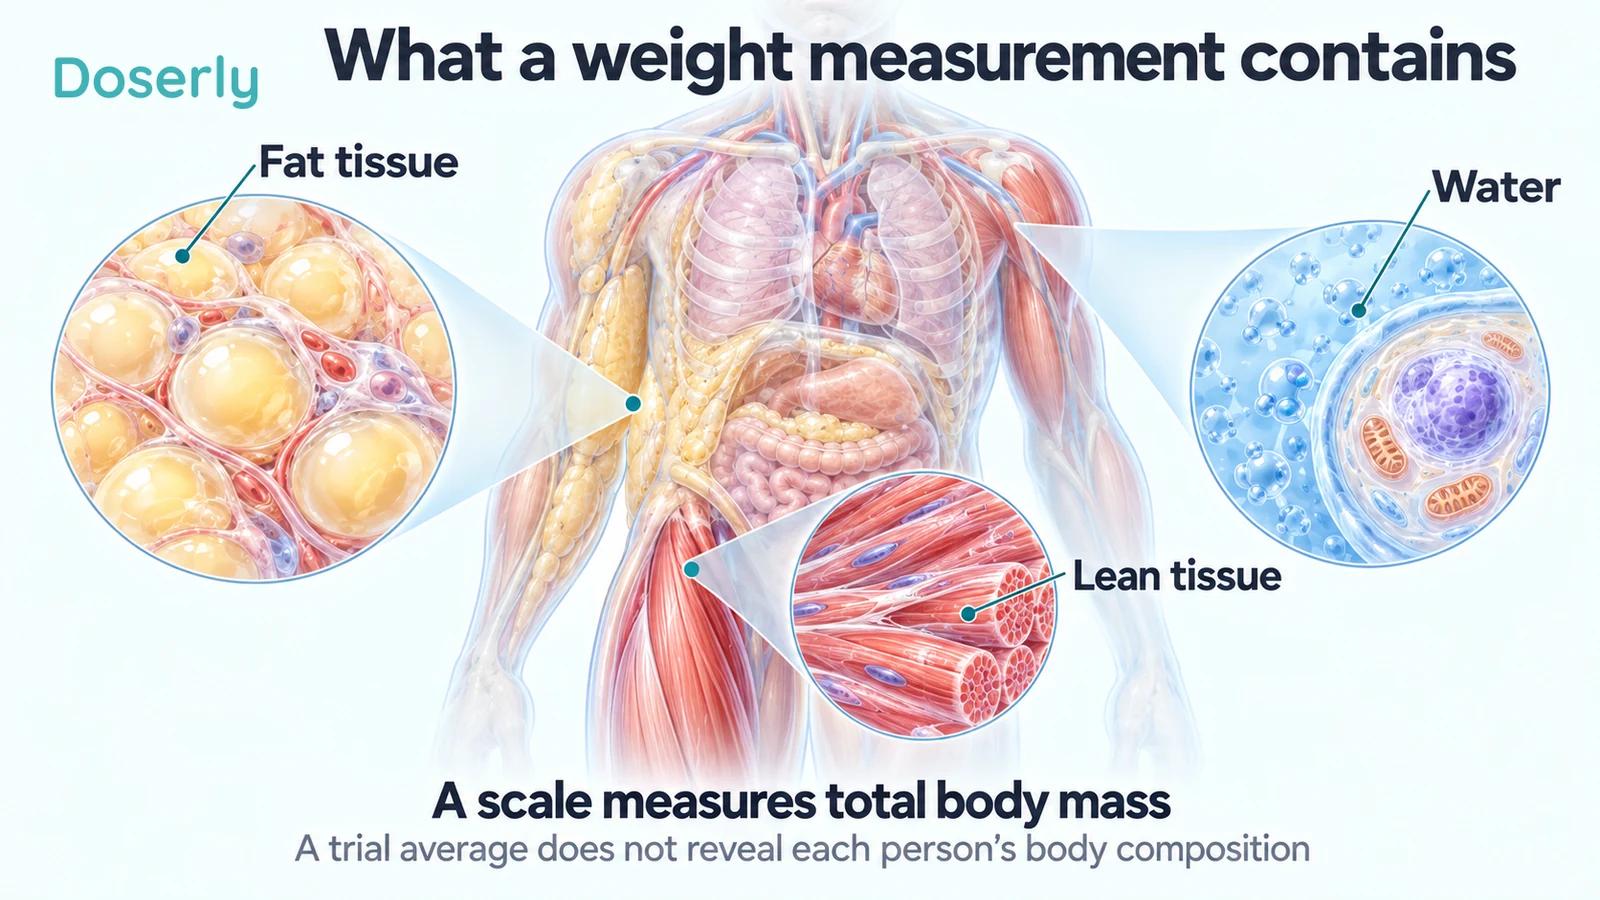
A scale records total body mass. It does not separately identify adipose tissue, muscle, other lean tissues, bone, water or intestinal contents. Therefore, a weight-loss curve alone cannot tell you how much fat a person lost or whether strength was preserved.
This distinction is visible in modern trials that add body-composition measurements. For example, REDEFINE 1 studied cagrilintide plus semaglutide and included a DXA subgroup that measured fat and lean soft tissue separately. That is a different treatment, and its composition findings cannot be assigned to retatrutide. It illustrates the extra measurement needed to answer a question the scale cannot. REDEFINE 1 methods and body-composition analysis.
Even “lean mass” is not a synonym for skeletal muscle. Nor is a change in measured tissue mass a direct test of physical function. Someone concerned about maintaining strength needs a clinical assessment that considers function, nutrition and appropriate measurements together.
Can you compare your curve with a different trial?
A study in people with type 2 diabetes is a useful example of why context matters. Retatrutide's 2023 diabetes phase 2 trial randomized 281 participants and used a different population, duration and primary question, with glycated hemoglobin as the main outcome. It included placebo and dulaglutide comparisons. It was not simply the obesity trial repeated with a new title. Diabetes trial report.
Differences between trials can reflect participant characteristics, background treatment, duration, comparator and analysis. Comparing endpoint percentages without those details can create an apparent ranking that no randomized head-to-head comparison actually tested.
The same problem arises when one person shares a particularly striking result online. Their account may be sincere and useful as a description of their experience. It usually cannot supply the standardized baseline, complete follow-up and comparison needed to turn that experience into a personal forecast for somebody else.
For treatment decisions, compare like with like where possible, then discuss the remaining differences explicitly. A clinician can help identify which population and outcome are most relevant to the health problem you are trying to improve.
A better way to use your own record
A dated record is most useful when it documents what actually happened. Note the measurement conditions, prescribed-treatment changes, symptoms and relevant changes in daily life. Consistency helps distinguish a sustained trend from isolated readings, while symptoms add information that the scale leaves out.
Avoid using a chart to enforce an imagined deadline. A slower reduction is not proof of treatment failure, and a faster reduction is not automatically a better outcome. Difficulty maintaining food or fluid intake deserves attention even if the plotted weight change looks impressive.
Retatrutide remains investigational in the current FDA statement checked for this article. A published curve does not provide instructions for self-treatment, and an online product bearing the name is not verified by the trial. FDA information on unapproved drugs.
Use research to form realistic questions: What outcome matters for my health? How will benefit and tolerability be assessed? What would prompt reassessment? A trial average helps describe what happened in a study. Your clinical plan needs to account for the person behind your measurements.
Sources
- Retatrutide obesity phase 2 trial, 2023: average and threshold outcomes.
- NCT04881760: eligibility and registered design.
- Retatrutide diabetes phase 2 trial, 2023: a different population and primary endpoint.
- ICH E9: statistical interpretation.
- ICH E9(R1): estimands and incomplete treatment.
- NIDDK, research behind the Body Weight Planner: dynamic weight change.
- REDEFINE 1, 2025: illustrative example of separate body-composition measurement with a different treatment.
- FDA, unapproved GLP-1 drugs: current US status.