
Peptides
October 16, 2026
Blood-sugar swings in diabetic cats: what exenatide research adds
On this page
A diabetic cat's glucose can look acceptable at one moment and quite different later in the day. Food, insulin, activity and stress all affect what a measurement captures. For a veterinarian trying to make treatment safer, the pattern matters alongside the average.
A 2020 paper investigated those fluctuations in cats receiving extended-release exenatide, a GLP-1 receptor agonist, alongside insulin and dietary care. It found lower glucose variability at some visits. Crucially, the researchers analysed measurements from an earlier trial; they did not recruit a second independent group of cats. Glucose-variability paper
The useful question is therefore specific: what did the additional analysis reveal about glucose patterns, and how does that relate to caring for a cat whose readings vary?
What does glucose variability mean?
Glucose variability describes the spread of glucose measurements over time. A sequence that stays close to its average has less variability than one that moves widely above and below that average.
Consider a purely mathematical example, not a feline treatment target. The numbers 9, 10 and 11 have the same average as 2, 10 and 18: ten. The second sequence is much more spread out. Knowing the average alone would hide that difference.
The paper used standard deviation, a statistical description of that spread. It is expressed in the same units as glucose. A larger standard deviation generally means greater dispersion around the average, but it does not tell you which specific readings were dangerously low or how long they lasted.
This distinction is practical. A low average might reflect mostly comfortable readings, or a mixture of excessively low and high values. A low standard deviation could describe a consistently appropriate pattern, or a consistently excessive glucose level. Neither number, read alone, describes good diabetes care.
Current AAHA guidance accordingly recommends interpreting glucose patterns alongside clinical signs and body weight. Monitoring can detect low glucose that is not apparent from the cat's behaviour. AAHA glucose-monitoring guidance
What did the researchers measure?
The analysis involved thirty newly diagnosed diabetic cats from a previous controlled study. All received glargine insulin and a low-carbohydrate diet; fifteen also received extended-release exenatide and fifteen saline placebo.
Researchers retrospectively evaluated 132 glucose curves obtained at scheduled follow-ups over sixteen weeks. Blood samples were taken about every two hours during an eight-to-twelve-hour period. These were intermittent blood measurements, not continuous sensor recordings. Study methods
A curve brings together repeated readings during an observation window. Its usefulness depends on when measurements occur and how closely the day resembles the cat's usual routine. If a brief low point occurs between samples, it may be missed. A curve collected on one day also cannot describe every other day that week.
The word “retrospective” here refers to the additional analysis. The original treatment study collected data prospectively, but the later researchers returned to those data to examine another question. That is a legitimate research approach; it simply has a different role from a new confirmatory experiment designed around variability from the outset.
What changed with exenatide?
At week six, the reported average standard deviation was 1.69 mmol/L in the exenatide group and 3.29 mmol/L with placebo. At week ten, the corresponding values were 1.14 and 4.34 mmol/L. The between-group comparisons were significant at those visits. Primary results
Those are variability values, not the cats' average glucose concentrations. Confusing the two would make the findings sound like severe low glucose in every treated cat, which is not what those numbers mean.
The results also describe particular visits. They should not be summarized as proof that exenatide made glucose more stable at every point throughout treatment. Repeated comparisons across visits and subgroups make it especially useful to look for a consistent pattern and confirmation in a later study.
The proposed biology is plausible: GLP-1 signalling can influence insulin secretion and other processes involved in glucose regulation. But this analysis did not establish exactly which biological action accounted for the observed difference. A statistical pattern in a glucose curve is not a direct measurement of beta-cell recovery.
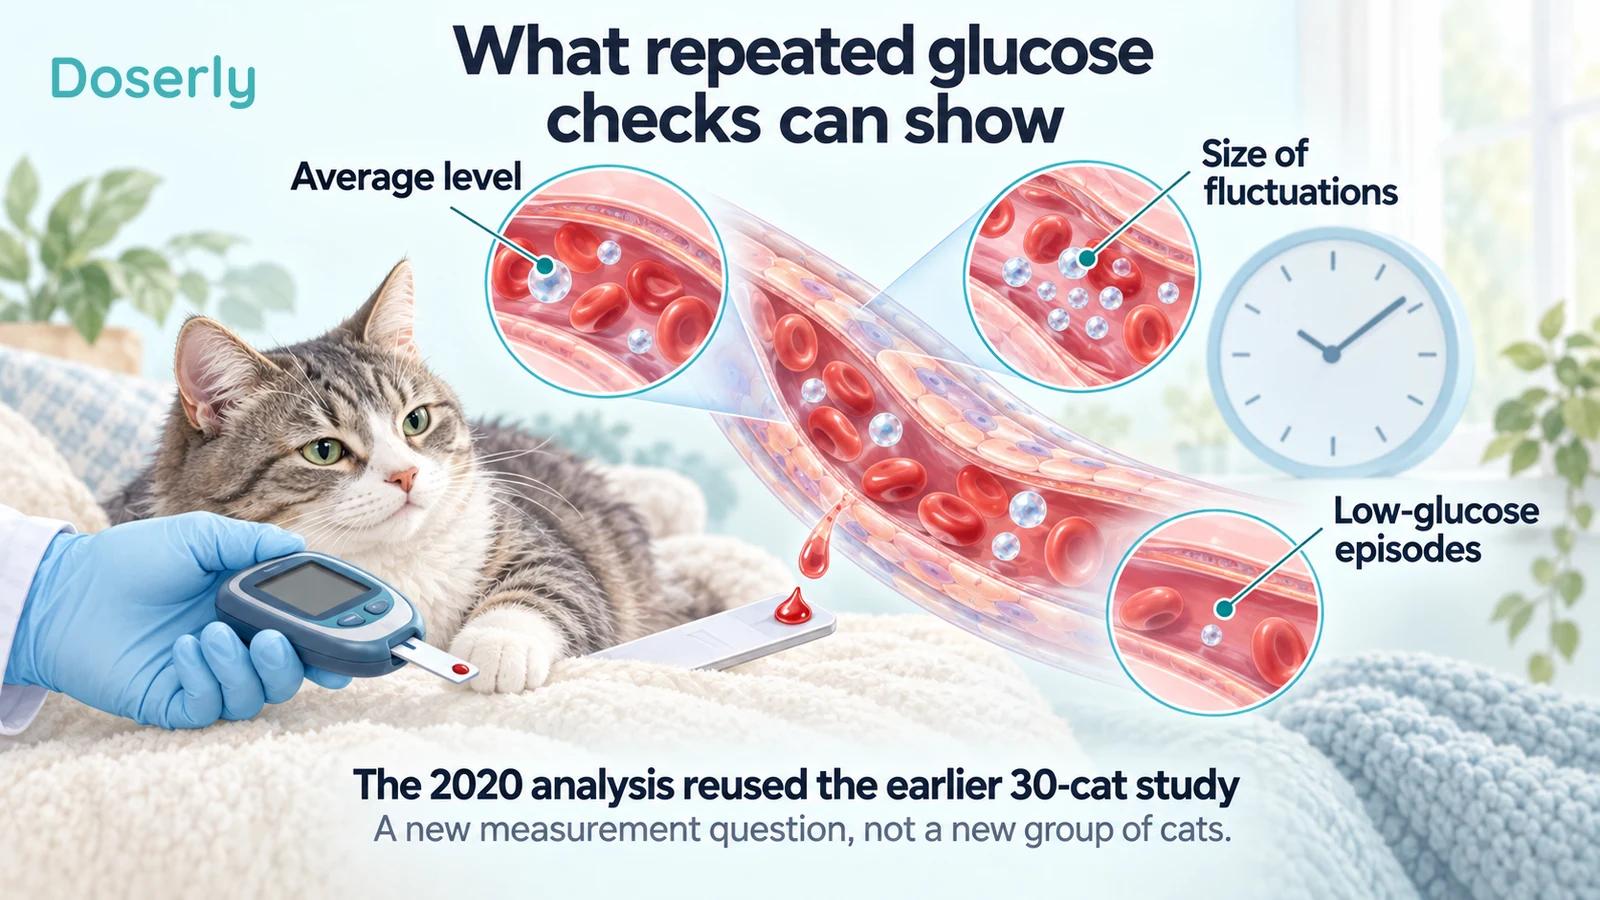
The artwork explains why repeated measurements can answer several questions. It contains no simulated study trace. The later paper reused the earlier cohort rather than adding thirty new animals.
Why two papers do not mean sixty cats
The original 2016 study assessed remission and metabolic control. It found remission in six of fifteen exenatide-treated cats versus three of fifteen placebo-treated cats, without a significant difference. Its methods used alternating assignment, with treatment known to veterinarians. Original controlled pilot
The 2020 paper examined another outcome in those same animals. Adding the sample sizes of both publications would count each cat twice. It would also give too much weight to the same underlying treatment allocation, clinical setting and selection criteria.
That does not make the later analysis unhelpful. One set of measurements can answer more than one scientifically useful question. What it cannot do is reproduce the experiment independently.
For an owner, the distinction changes the conversation from “several trials prove it works” to “one small treatment study generated several findings.” The latter description leaves room to discuss the findings without overstating how widely they have been tested.
Does less variability mean a better chance of remission?
The analysis also compared cats that eventually entered remission with those that did not. Differences in variability suggested a possible relationship worth studying. They do not establish that deliberately reducing standard deviation causes remission.
Several explanations remain possible. Better residual insulin production could both stabilize glucose and make remission more likely. Improving overall diabetes control could influence both. A treatment could affect one measure without being sufficient to change the other.
To turn variability into a useful prediction tool, researchers would need to test a rule prospectively in new cats. The rule would need to perform well before the outcome is known, not merely distinguish groups after the investigators have seen who entered remission.
Current iCatCare guidance describes remission as a clinical state confirmed over time, not a result inferred from one variability statistic. iCatCare consensus
For owners, that means a smoother curve may be encouraging information, but it is not permission to stop insulin. The veterinary team still needs to assess the overall pattern, treatment needs and clinical course.
What could intermittent measurements miss?
Suppose a cat is measured at breakfast and then at intervals through the day. The lowest glucose might occur between checks. If the readings around it look reasonable, the calculated average and standard deviation can underestimate the extent of the dip.
Missing curves create another limitation. Not every animal contributes every scheduled assessment. The available data may still be informative, but a perfectly complete record of each cat's daily experience should not be imagined where none exists.
There is also a difference between variation within one day and variation between days. A cat may have a fairly smooth curve on Monday and a different response on Thursday. Looking only at within-day dispersion does not establish that treatment has become predictable across the week.
These are reasons to match the monitoring method to the clinical question. They are not reasons to dismiss home measurements. Even an imperfect record can reveal a pattern that helps a veterinarian ask better questions about appetite, injection timing, illness or the duration of insulin action.
How do continuous sensors change the picture?
Continuous glucose monitors collect many more readings by measuring glucose in interstitial fluid, the fluid between cells. They can reveal patterns that occasional blood samples miss, including overnight changes.
They do not measure directly inside a blood vessel. That difference matters when glucose is changing quickly or when readings are low. A sensor value and a blood-meter value obtained close together need not be identical.
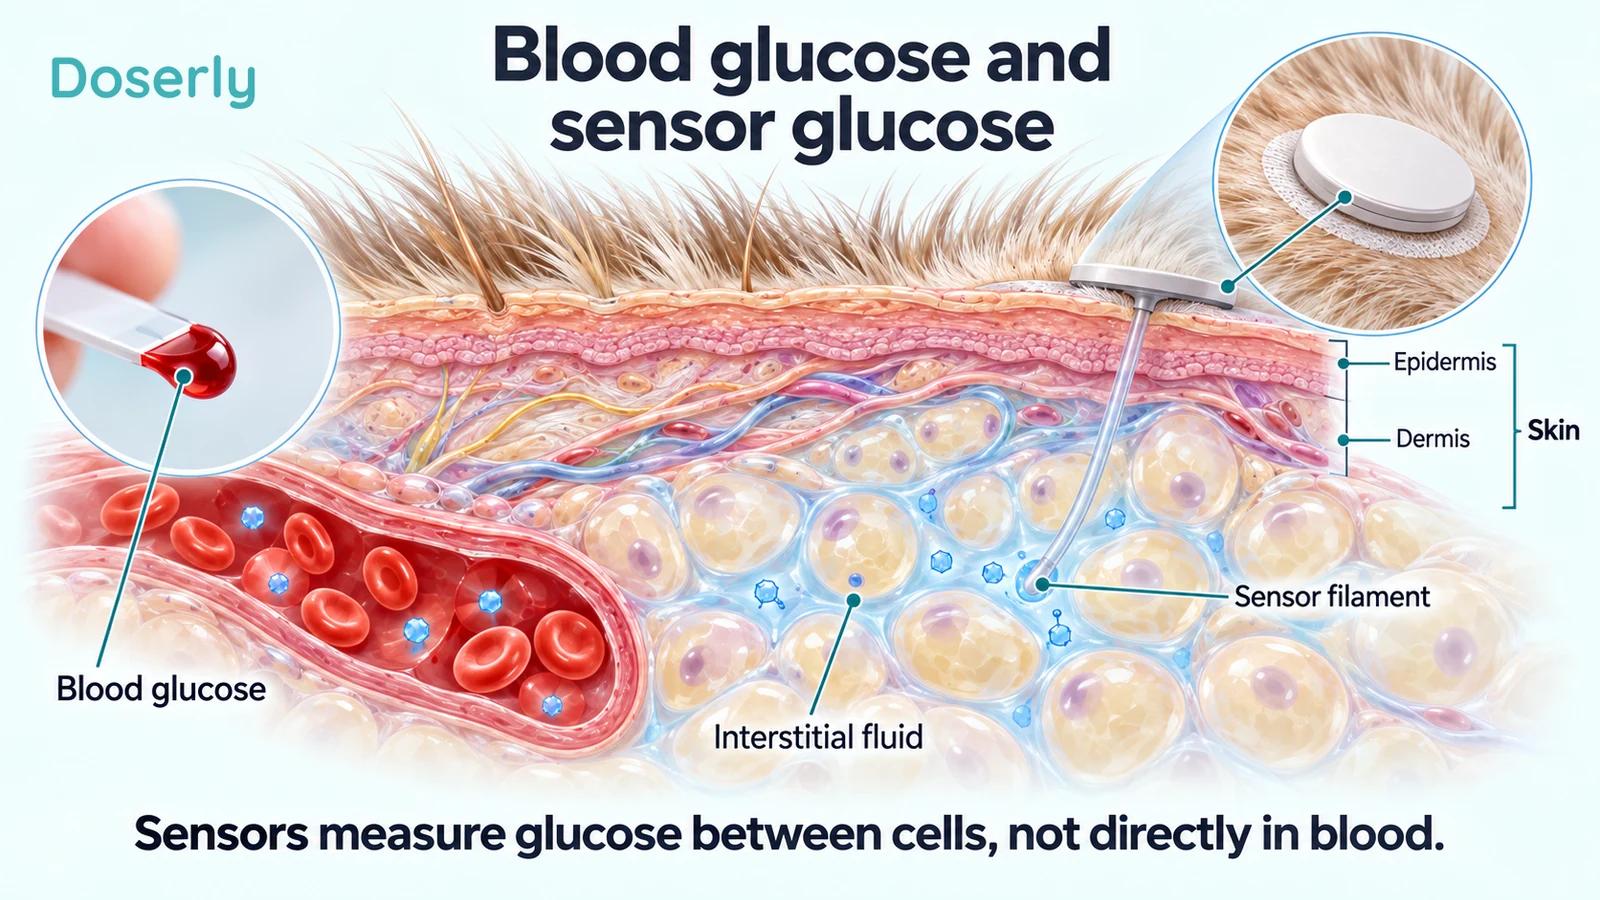
The sensor samples glucose in fluid between cells. The blue shapes symbolize glucose and are not molecular-scale drawings. The illustration explains the measurement site, not a home insertion technique.
A 2025 validation study examined FreeStyle Libre 3 in seven healthy cats under experimentally controlled low-glucose conditions. Sensor readings showed a glucose-dependent bias, including overestimation of blood glucose in marked hypoglycemia. Sensor-accuracy study
That result does not mean the device is useless. It means interpretation must account for its measurement limits. The many paired readings in a validation experiment are also not the same as evidence from hundreds of separate cats living with diabetes.
The veterinarian should explain what to do if a sensor reading is unexpectedly low, does not fit the cat's condition, or changes rapidly. Waiting for visible symptoms is not a reliable way to decide whether a concerning reading matters.
What can an owner contribute without interpreting every fluctuation?
A good record gives glucose data context. Note when prescribed insulin was given, when the cat ate, whether appetite was normal and whether anything unusual happened. A missed meal, vomiting episode or difficult injection may explain why one day deserves closer attention.
Keep the observations factual. “Ate half the usual breakfast” is more useful than “glucose control was bad.” Similarly, report a displayed value with its time and device rather than translating it into a diagnosis.
Ask the veterinary team which patterns they want reported urgently and how they prefer to receive routine data. Sharing every isolated fluctuation without context can make the signal harder to find; ignoring all unexpected values can miss a safety issue.
Cornell's owner guidance emphasizes monitoring alongside veterinary review and advises against changing insulin doses independently. Cornell monitoring advice
Does this paper justify adding exenatide?
It supports further investigation of an adjunct treatment and a potentially useful measurement. It does not establish a standard exenatide regimen for cats with variable readings.
Before considering another drug, the clinical question should be clear. Is the concern a low point, insufficient duration of insulin action, persistent high glucose, poor appetite, or day-to-day unpredictability? Those patterns are not interchangeable and may require different responses.
Our human semaglutide guide provides broader GLP-1 background, but neither human GLP-1 success nor this feline secondary analysis determines the right treatment for a particular pet.
The useful lesson is that glucose control has several dimensions. Average level, fluctuations, low episodes and daily wellbeing each add information. The exenatide analysis contributes to that understanding while leaving the central treatment decision with individualized veterinary assessment and better prospective research.
Sources
- Krämer and colleagues, glycemic variability, 2020.
- Riederer and colleagues, original exenatide study, 2016.
- AAHA, glucose monitoring, 2026.
- FreeStyle Libre 3 feline validation study, 2025.
- iCatCare diabetes consensus, 2025.
- Cornell, feline diabetes.