
Peptides
October 16, 2026
Why phase 2 and phase 3 survodutide percentages need context
On this page
Survodutide's weight-loss results can look inconsistent when they appear as isolated percentages. An early report may emphasize nearly 19% weight loss, while a later phase 3 paper reports approximately 13% in its main analysis. That doesn't mean the medicine changed or that one result must be wrong.
The studies asked related but different questions. They used different doses, follow-up periods and statistical approaches. Even within one trial, researchers can report more than one valid estimate, depending on how they account for stopping treatment and taking other medicines.
For someone interested in the possible benefits, the task is to identify which result describes which situation. A phase number tells you where a study sits in development; it does not make its percentage directly comparable with every earlier percentage. Phase 2 obesity trial, SYNCHRONIZE-1
Our survodutide guide provides the broader background. Here we'll compare the two obesity trials in adults without diabetes and explain the numbers most likely to cause confusion.
What was the phase 2 trial trying to learn?
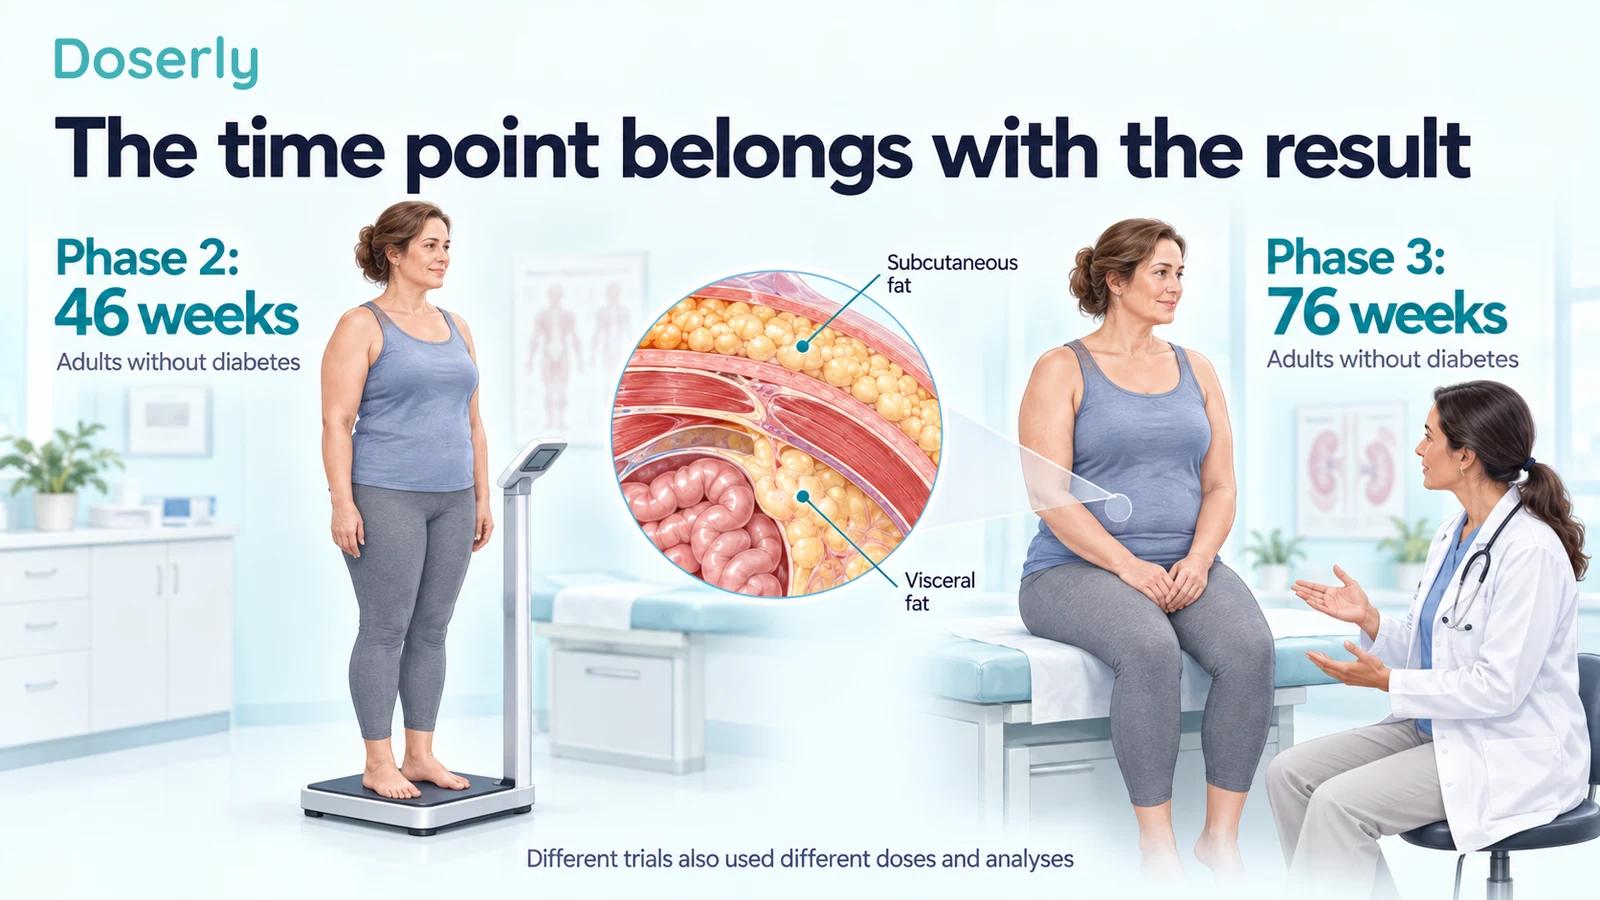
The phase 2 study was a dose-finding trial. It compared four assigned once-weekly survodutide targets with placebo over 46 weeks. The study treated 386 adults with BMI of at least 27 who did not have diabetes. Its main endpoint was percentage change in body weight.
The assigned doses were 0.6, 2.4, 3.6 and 4.8 mg weekly. The study included 20 weeks of dose escalation and 26 weeks of maintenance. Researchers wanted to see how weight response and tolerability changed across the tested exposures. Original phase 2 methods
That purpose matters. A dose-finding study isn't simply a smaller version of a later confirmatory trial. It helps choose which regimens deserve further testing. The trial can also reveal problems with escalation, adherence or endpoint measurement that influence the next design.
Its primary analysis was based on the dose assigned at randomization. It included a modified intention-to-treat population and censored data associated with COVID-19-related discontinuation. A separate sensitivity analysis grouped participants by the dose actually received during maintenance and used on-treatment data.
Why do phase 2 reports quote different figures?
In the planned-treatment analysis, mean weight changes across the four survodutide groups were −6.2%, −12.5%, −13.2% and −14.9%, compared with −2.8% with placebo. The 14.9% result is therefore the highest assigned-dose estimate in the primary analysis. Published primary results
The larger 18.7% figure widely associated with the study comes from the analysis based on actual maintenance treatment. A subsequent original research abstract from the trial investigators explicitly identifies that figure as an actual-treatment result. Investigators' cardiometabolic analysis
Those analyses answer different questions. Grouping people by the dose they actually reached can be informative about exposure and response, but it doesn't preserve the original randomized groups in the same way. Tolerability, dose changes and persistence can influence who contributes to each maintenance-dose category.
It is therefore misleading to treat 18.7% as the outcome every participant assigned to the highest dose would experience. It is also misleading to call it fabricated merely because another analysis produced 14.9%. The interpretation depends on its analysis label.
What changed in phase 3?
SYNCHRONIZE-1 compared two survodutide target regimens with placebo over 76 weeks. It randomized 726 adults and treated 725. Participants had BMI of at least 30, or at least 27 with an obesity-related complication, and did not have diabetes.
The targets were 3.6 and 6.0 mg weekly. Participants also received counseling on reduced-calorie eating and physical activity. The trial assessed both average percentage weight change and the proportion reaching at least 5% weight reduction. Phase 3 design
The longer duration creates more opportunity for weight change, but also more opportunity for interruptions, discontinuation, additional treatment and changes in adherence. Longer follow-up doesn't guarantee that the reported average must be numerically larger.
The phase 3 population also wasn't a continuation of the phase 2 participants. It was a new randomized sample, with its own characteristics and treatment experience. This prevents a simple “before and after development” comparison.
The phase 3 primary estimate included treatment changes
The main phase 3 analysis used a treatment-regimen estimand. An estimand defines the treatment-effect question, including how events after randomization are handled. Here, the analysis incorporated early discontinuation, use of prohibited obesity medicines and prolonged dose escalation.
At week 76, average weight changes were −12.2% with the lower target, −13.0% with the higher target and −5.4% with placebo. The paper reports an adjusted placebo difference of −7.5 percentage points for the higher target. That adjusted contrast should be taken from the model, rather than reconstructed by subtracting rounded published means. Primary phase 3 results
The trial also reported an efficacy estimand: a hypothetical treatment effect if participants adhered to their assigned regimen and did not receive prohibited obesity therapy, while retaining the effects of prolonged escalation. That analysis gave mean changes of −15.3%, −16.6% and −3.2%.
The efficacy estimate is not simply a raw average among successful completers. It is a model-based answer to a specified hypothetical question. The treatment-regimen estimate is likewise a trial estimate, not a precise forecast of everyday clinical practice.
Why the placebo group belongs in the comparison
A treatment group's change from baseline is not the same as the treatment's advantage over placebo. Both are useful, but they answer different questions.
For example, the phase 2 primary highest-dose result was 14.9% average loss while placebo lost 2.8%. The phase 3 primary higher-target result was 13.0% while placebo lost 5.4%. Comparing only 14.9 with 13.0 hides the change in the comparator group's outcome.
The phase 3 paper reports that 16.5% of placebo participants used another medicine with GLP-1 receptor activity during the trial, most often after discontinuing assigned treatment. This was much more common than in the survodutide groups. It is one reason the analysis strategy matters. Concomitant medicines
It does not follow that all placebo weight loss came from those medicines. Lifestyle counseling, individual behavior and other factors also belong to the trial context. The point is that “placebo” describes the assigned comparison, while later treatment experiences may be more complicated.
A fair description uses the treatment and comparator results from the same analysis, at the same time point.
Treatment persistence changes what can be estimated
In phase 2, 233 of 386 treated participants completed the 46-week treatment period. In phase 3, 91.3% completed trial follow-up, but only 63.4% were still receiving the assigned treatment at week 76. These are different completion measures. Phase 2 disposition, phase 3 disposition
Someone can stop injections and still attend the final visit. Their weight measurement helps describe outcomes after treatment initiation. Someone who leaves follow-up may have an unknown final weight, requiring assumptions in the analysis.
The ICH statistical guidance emphasizes specifying how such events fit the question and examining the robustness of conclusions to assumptions. This is not a technical loophole; it is a necessary response to the fact that people don't all remain on treatment exactly as planned. ICH E9(R1)
The more useful question is not which analysis produces the most impressive number. It is which analysis addresses the decision being discussed, and how well the available data support it.
Why a higher target dose doesn't settle the comparison
The highest phase 2 target was 4.8 mg, while phase 3 included 6.0 mg. It is tempting to assume the latter should automatically produce a larger percentage. But assigned target dose is only one part of exposure.
The escalation schedule, time at the maintenance dose, dose reductions and interruptions all affect actual treatment. In phase 3, the protocol initially required discontinuation after three or more missed doses, and a later amendment permitted restarting. Such operational details influence persistence and therefore the outcome being estimated. Phase 3 treatment methods
Dose-response relationships can also be nonlinear. Greater exposure may add relatively little benefit while increasing adverse effects for some people. A trial's group average cannot tell an individual which amount would optimize their own benefit-risk balance.
This is why study doses should be described as research regimens, not converted into a self-directed escalation schedule.
Do the percentages measure fat loss?
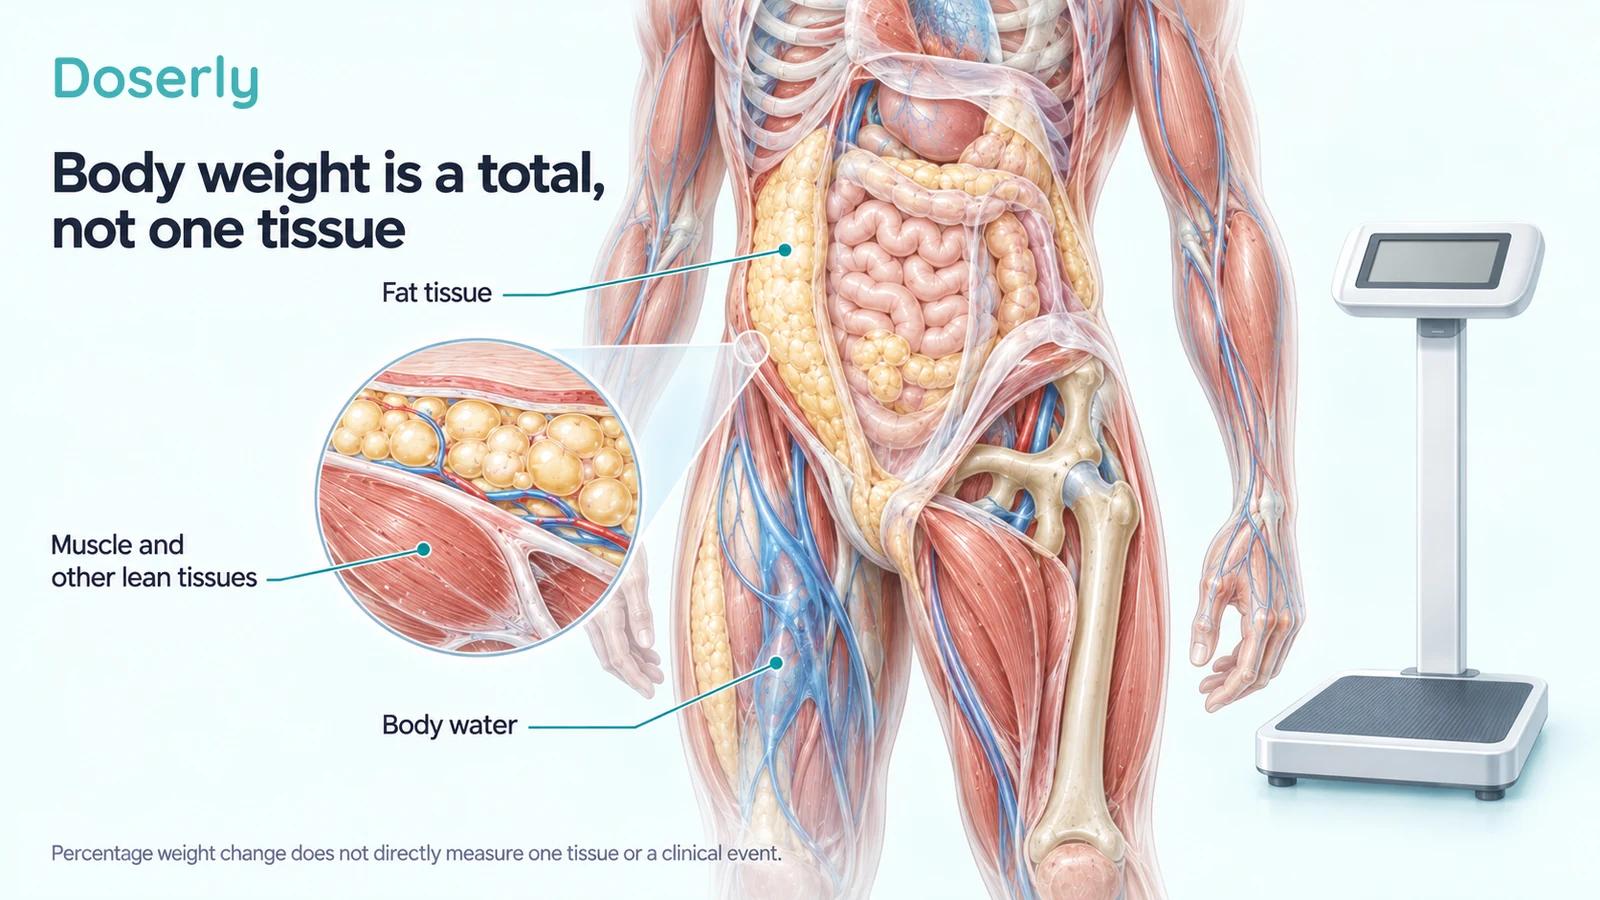
The main obesity endpoint was body weight, which includes fat, lean tissues and water. A percentage change in total weight doesn't show how each component changed.
SYNCHRONIZE-1 included a small MRI body-composition substudy. Its reported analysis involved 25 participants per group who had the required scans and met the specified treatment conditions. The study found changes in fat and lean body volume, but those selected subgroup findings are not interchangeable with the main outcome in all 725 treated participants. Body-composition substudy
A claim of “13% fat loss” would therefore mislabel the primary result. A claim that the medicine preserved all muscle would also require evidence beyond total body weight or a broad lean-volume measurement.
The distinction is useful for patients because the goal is usually better health and function, not simply the lowest number on the scale. Weight, body composition, symptoms and physical function can provide complementary information.
The diabetes trial is another separate comparison
People with type 2 diabetes were excluded from these two obesity trials. A different survodutide phase 2 study enrolled adults taking metformin and made HbA1c change its primary outcome over 16 weeks.
Its regimens included weekly and twice-weekly administration, and its largest weight reduction came from a twice-weekly arm. It also included an open-label semaglutide reference group. Diabetes dose-finding trial
Placing its weight percentage beside a 46- or 76-week obesity result without those details creates another misleading comparison. The participants, starting glucose, background therapy and primary question differ.
Diabetes findings remain valuable for the population studied. They simply shouldn't be folded into a universal survodutide percentage that ignores the clinical setting.
What would make a stronger comparative claim?
A direct comparison would assign similar participants within the same study to the treatments or regimens being compared, follow them for the same duration, and use a common outcome and analysis strategy. That design reduces many of the differences that complicate comparisons across separate trials.
Even then, the result would need interpretation alongside uncertainty, adverse effects and applicability. A mean advantage does not imply every participant benefited more, and a larger weight reduction doesn't automatically establish a larger benefit on every complication.
Cross-trial comparisons can help generate hypotheses and plan research. They are less suited to declaring that a later trial “failed” because its headline number was smaller, or that one medicine is superior because its largest published estimate exceeds another's.
The phase 2 and phase 3 survodutide studies both found weight reductions relative to their own placebo comparisons. Their different percentages are best understood as results produced by different study conditions.
How to read the next survodutide headline
Look for the population, duration, assigned regimen, comparator and analysis label. Then check whether the percentage is an average change or the proportion of participants who crossed a threshold. Those are different endpoints even when they appear beside one another.
For an individual discussion, ask what outcome matters beyond weight and how tolerability affects the chance of continuing. A trial average can inform expectations, but it cannot predict one person's response with the precision implied by a single decimal place.
The survodutide guide brings together the program's findings. Keeping each percentage attached to its study makes that evidence easier to use and avoids both inflated promises and unfair dismissal of a positive trial.
Sources
- Le Roux and colleagues, phase 2 obesity trial, 2024.
- Original investigator analysis of cardiometabolic parameters, 2024 conference abstract. Used to identify the actual-treatment 18.7% figure.
- Le Roux and colleagues, SYNCHRONIZE-1, 2026.
- ICH E9(R1), estimands and sensitivity analysis.
- Blüher and colleagues, diabetes dose-finding trial, 2024.